PakAlumni Worldwide: The Global Social Network
The Global Social Network
Rising Share of Income of Poorest 20% Pakistani Households
The share of national income of Pakistan's poorest 20% of households has increased from 8.1% to 9.6% since 1990 , according to the United Nations Economic and Social Commission for Asia and Pacific (NESCAP) Statistical Yearbook for 2015. It's the highest share of income for the bottom income quintile in the region.
Income Share Change in Asia's Poorest Quintile:
The countries where people in the poorest income quintile have increased their share of total income include Kyrgyzstan (from 2.5 per cent to 7.7), the Russian Federation (4.4 per cent to 6.5), Kazakhstan (7.5 per cent to 9.5) and Pakistan (8.1 per cent to 9.6). India's bottom income quintile has seen its share of income drop from 9% to 7.8%.
|
Bottom Quintile Income Share Change. Source: UNESCAP Statistical Ye... |
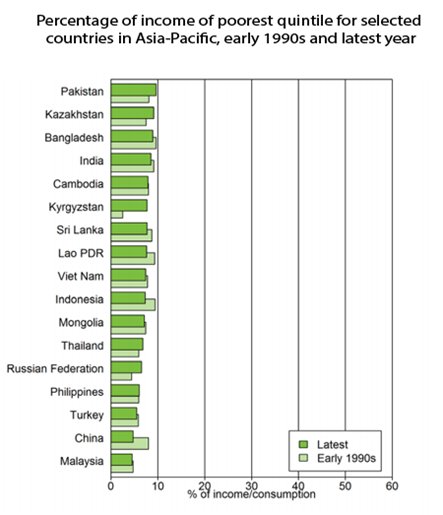
Although more people in China have lifted themselves out of poverty than any other country in the world, the poorest quintile in that country now accounts for a lower percentage of total income (4.7 per cent) than in the early 1990s (8.0 per cent). The same unfortunate trend is observed for a number of other countries, including in Indonesia (from 9.4 per cent to 7.6) and in the Lao People’s Democratic Republic (from 9.3 per cent to 7.6).
Credit Suisse Wealth Report 2017:
Data released by Credit Suisse with its Global Wealth Report 2017 shows that Pakistan is the most egalitarian nation in South Asia. It also confirms that the median wealth of Pakistani households is three times higher than that of households in India.
Here is per capita wealth data for India and Pakistan as of mid-2017, according to Credit Suisse Wealth Report 2017 released recently.
Pakistan average wealth per adult: $5,174 vs India $5,976
Pakistan median wealth per adult: $3,338 vs India $1,295
Average household wealth in Pakistan is $15,522 (3 adults) vs India $14,940 (2.5 adults)
Median household wealth in Pakistan is $10,014 (3 adults) vs India $3,237 (2.5 adults)
Pakistan Gini Index 52.6% vs India 83%
World Bank Update on Pakistan:
A November 2016 World Bank report says that Pakistan has successfully translated economic growth into the well-being of its poorest citizens. It says "Pakistan’s recent growth has been accompanied by a staggering fall in poverty".
Rising incomes of the poorest 20% in Pakistan since 2002 have enabled them to enhance their living standards by improving their diets and acquiring television sets, refrigerators, motorcycles, flush toilets, and better housing.
Another recent report titled "From Wealth to Well Being" by Boston Consulting Group (BCG) also found that Pakistan does better than India and China in translating GDP growth to citizens' well-being.
One particular metric BCG report uses is growth-to-well-being coefficient on which Pakistan scores 0.87, higher than India's 0.77 and China's 0.75.
Big Poverty Decline Since 2002:
Using the old national poverty line of $1.90 (ICP 2011 PPP) , set in 2001, the percentage of people living in poverty fell from 34.7 percent in FY02 to 9.3 percent in FY14—a fall of more than 75 percent. Much of the socioeconomic progress reported by the World Bank since 2000 has occurred during President Musharraf's years in office from 2000-2007. It has dramatically slowed or stagnated since 2010.
|

Using the new 2016 poverty line of $3.50 (ICP 2011 PPP), 29.5 percent of Pakistanis as poor (using the latest available data from FY14). By back casting this line, the poverty rate in FY02 would have been about 64.3 percent.
Pakistan's new poverty line sets a minimum consumption threshold of Rs. 3,030 or $105 (ICP 2011 PPP) per person per month or $3.50 (ICP 2011 PPP) per person per day. This translates to between Rs. 18,000 and Rs. 21,000 per month for a household at the poverty line, allowing nearly 30% of the population or close to 60 million people to be targeted for pro-poor and inclusive development policies—thus setting a much higher bar for inclusive development.
Multi-dimensional Poverty Decline:
A UNDP report released in June 2016 said Pakistan’s MPI (Multi-dimensional poverty index) showed a strong decline, with national poverty rates falling from 55% to 39% from 2004 to 2015. MPI goes beyond just income poverty.
The Multidimensional Poverty Index uses a broader concept of poverty than income and wealth alone. It reflects the deprivations people experience with respect to health, education and standard of living, and is thus a more detailed way of understanding and alleviating poverty. Since its development by OPHI and UNDP in 2010, many countries, including Pakistan, have adopted this methodology as an official poverty estimate, complementing consumption or income-based poverty figures.
Rising Living Standards of the Poorest 20% in Pakistan:
According to the latest World Report titled "Pakistan Development Update: Making Growth Matter" released this month, Pakistan saw substantial gains in welfare, including the ownership of assets, the quality of housing and an increase in school enrollment, particularly for girls.

First, the ownership of relatively more expensive assets increased even among the poorest. In the bottom quintile, the ownership of motorcycles increased from 2 to 18 percent, televisions from 20 to 36 percent and refrigerators from 5 to 14 percent.
In contrast, there was a decline in the ownership of cheaper assets like bicycles and radios.

Housing quality in the bottom quintile also showed an improvement. The number of homes constructed with bricks or blocks increased while mud (katcha) homes decreased. Homes with a flush toilet almost doubled in the bottom quintile, from about 24 percent in FY02 to 49 percent in FY14.
Dietary Improvements for the Poorest 20% in Pakistan:
Decline in poverty led to an increase in dietary diversity for all income groups.
For the poorest, the share of expenditure devoted to milk and milk products, chicken, eggs and fish rose, as did the share devoted to vegetables and fruits.
In contrast, the share of cereals and pulses, which provide the cheapest calories, declined steadily between FY02 and FY14. Because foods like chicken, eggs, vegetables, fruits, and milk and milk products are more expensive than cereals and pulses, and have lower caloric content, this shift in consumption also increased the amount that people spent per calorie over time.
For the poorest quintile, expenditure per calorie increased by over 18 percent between FY02 and FY14. Overall, this analysis confirms that the decline in poverty exhibited by the 2001 poverty line is quite credible, and that Pakistan has done remarkably well overall in reducing monetary poverty based on the metric it set some 15 years ago, says the World Bank.
Summary:
Pakistan is among the most economically egalitarian nations in the world. In spite of the country's many challenges on multiple fronts, it has successfully translated its GDP growth into the well-being of its poorest citizens. The share of national income of Pakistan's poorest 20% of households has increased from 8.1% to 9.6% since 1990, according to the United Nations Economic and Social Commission for Asia and Pacific (NESCAP) Statistical Yearbook for 2015. It's the highest share of income for the bottom income quintile in the region. "Pakistan’s recent growth has been accompanied by a staggering fall in poverty", says a November 2016 World Bank report. An earlier report by Boston Consulting Group reached a similar conclusion.
Related Links:
Credit Suisse Wealth Report 2017
Pakistan Translates GDP Growth to Citizens' Well-being
Views: 396
-
Comment by Riaz Haq on December 6, 2017 at 1:43pm
-
India’s richest 20% account for 45% of income
Middle India is largely rural and uneducated, shows the ‘Household Survey on India’s Citizen Environment & Consumer Economy’
http://www.livemint.com/Politics/AvHvyHVJIhR0Q629wkPS5M/Indias-rich...
India’s richest quintile accounts for 45% of aggregate household disposable income while the poorest quintile earns barely 7% of the aggregate income pie, according to the latest data from a nationally representative survey conducted this year.
The Household Survey on India’s Citizen Environment & Consumer Economy (ICE 360° survey), covering 61,000 households, is one of the largest consumer economy surveys in the country since the National Sample Survey Office (NSSO) conducted the consumer expenditure survey in 2011-12.
The survey results show that households in the top quintile earn nearly four times as much as households in the bottom quintile. But given that poorer households also tend to be bigger, the difference in per capita incomes is greater. The per capita income of the top quintile, at Rs7,974 per month, is nearly 6.5 times that of the bottom quintile. Given the lower income and the bigger household size, poorer households end up spending most of what they earn. The poorest quintile is able to save just 10% of household earnings. In contrast, the top quintile is able to save 47% of household earnings, the survey shows.
-
-
From Household Integrated Economic Survey (HIES) of Pakistan
Bottom Quintile Per Capita Expenditure Rs. 2,295 in 2015-16 up from Rs. 1,972 in 2013-14
Top Quintile Per Capita Expenditure Rs. 10,937 in 2015-16 up from Rs. 8,768 in 2013-14
Total Per Capita Expenditure Rs. 5,166 in 2015-16 up from Rs. 4,372 in 2013-14
Ratio of top to bottom quintile in 2015-16 is 4.76 up from 4.35 in 2013-14
TABLE 3.5.C PER CAPITA MONTHLY CONSUMPTION EXPENDITURE BY QUINTILES AND REGION
QUINTILES
2013-14 2015-16
URBAN RURAL TOTAL URBAN RURAL TOTAL
1ST 2021 1962 1972 2357 2284 2295
2ND 2764 2769 2768 3203 3165 3174
3RD 3538 3522 3527 4074 4058 4063
4TH 4612 4592 4601 5394 5340 5363
5TH 9371 7917 8768 11920 9364 10937
TOTAL 5493 3700 4327 6888 4239 5166
See table -22 in the main body of this report for further disaggregation.
http://www.pbs.gov.pk/sites/default/files/pslm/publications/hies15-...
-
-
Pakistan
Country Indicators
Poverty headcount ratio at $1.90 a day (2011 PPP) (% of population)
7.9% 2011 6.1% 2013
Shared Prosperity: Annualized growth in per capita real survey mean consumption or income (%), circa 2009 - 2014
2.8% bottom 40% 2.5% total
Population, total (millions)
189.4 2015 193.2 2016
GNI per capita, Atlas method (current US$)
$1,430 2015 $1,510 2016
GDP growth (annual %)
4.7% 2015 5.7% 2016
http://povertydata.worldbank.org/poverty/country/PAK
India
Country Indicators
Poverty headcount ratio at $1.90 a day (2011 PPP) (% of population)
31.1% 2009 21.2% 2011
Population, total (millions)
1,309.1 2015 1,324.2 2016
GNI per capita, Atlas method (current US$)
$1,600 2015 $1,680 2016
GDP growth (annual %)
8% 2015 7.1% 2016
http://povertydata.worldbank.org/poverty/country/IND
-
-
Per Capita income in #Pakistan grew 22% since 2012, half of the 43% growth in #India during the same period. #China topped with 48%
China: 48%
India: 43%
Turkey: 32%
Indonesia: 29%
Pakistan: 22%
UK: 15%
US: 15%
Japan: 15%
Germany: 13%
Canada: 13%
France: 11%
Saudi Arabia: 10%
Greece: 9.5%
Russia: 8%
Italy: 8%
Nigeria: 7.5%
Brazil: 0%
Source: https://twitter.com/spectatorindex/status/938475909971152897https://data.worldbank.org/indicator/NY.GDP.PCAP.CD?end=2016&lo...
https://data.worldbank.org/indicator/NY.GDP.PCAP.PP.CD?end=2016&...
-
-
#Pakistan has the highest intergenerational income #mobility and the lowest #inequality among emerging economies. #WEF2018 #Davos https://www.weforum.org/agenda/2018/01/economist-plan-to-heal-fract... …
-
-
World Bank's Poverty and Shared Poverty Report 2018 compares the annual income growth rate of the bottom 40% of the population with the average income growth of the entire population for 91 countries for years 2010-2015. Here's the data for a few selected countries:
Country Bottom 40% income growth vs Average Income Growth
Pakistan 2.7% vs 4.3%
Bangladesh 1.4% vs 1.5%
Iran 1.3% vs -1.3%
Indonesia 4.8% vs 4.8%
Sri Lanka 4.8% vs 5.3%
Vietnam 5.2% vs 3.8%
Thailand 5.0% vs 3.0%
Malaysia 8.3% vs 6.0%
China 9.1% vs 7.4%
http://www.worldbank.org/en/publication/poverty-and-shared-prosperity
People experience poverty differently even within the same household. Traditional measures haven’t been able to capture variations because the surveys stop at the household level. Measuring poverty as experienced by individuals requires considering how resources are shared among family members. While data are limited, there is evidence that women and children are disproportionately affected by poverty in many — but not all — countries. Sex differences in poverty are largest during the reproductive years, when, because of social norms, women face strong trade-offs between reproductive care and domestic responsibilities on the one hand and income-earning activities on the other hand. Worldwide, 104 women live in poor households for every 100 men. However, in South Asia, 109 women live in poor households for every 100 men. Children are twice as likely as adults to live in poor households. This primarily reflects the fact that the poor tend to live in large households with more children.
There is evidence from studies in several countries that resources are not shared equally within poor households, especially when it comes to more prized consumption items. There is also evidence of complex dynamics at work within households that go beyond gender and age divides. More surveys are needed to capture consumption patterns of individuals so that governments can implement policies to bridge the inequalities within households.
-
-
Punjab leads in household income, according to HIES 2018-19
https://tribune.com.pk/story/2202912/2-punjab-leads-household-income/
The monthly income of all quintiles increased in the range of 5% to 22% and the major surge was recorded in the income of the lowest two quintiles, which appeared to be beneficiaries of the government’s economic policies.
The lowest quintile’s average monthly income stood at Rs23,192, higher by Rs3,450 or 17.5% and sufficient to finance the expenses.
The second-lowest quintile’s income stood at Rs29,049, which was 22% or Rs5,223 more than the previous year’s income and also higher than the pace of increase in expenses.
The middle-income group saw a 12% increase in its income to Rs31,373. The higher middle-income group’s average monthly income increased to Rs37,643, showing 11.8% growth.
The average monthly income of the highest income group was estimated at Rs63,544, higher by 5.1%, still short of matching the growth in expenses.
Comment
Twitter Feed
Live Traffic Feed
Sponsored Links
South Asia Investor Review
Investor Information Blog
Haq's Musings
Riaz Haq's Current Affairs Blog
Please Bookmark This Page!
Blog Posts
Pakistani Student Enrollment in US Universities Hits All Time High
Pakistani student enrollment in America's institutions of higher learning rose 16% last year, outpacing the record 12% growth in the number of international students hosted by the country. This puts Pakistan among eight sources in the top 20 countries with the largest increases in US enrollment. India saw the biggest increase at 35%, followed by Ghana 32%, Bangladesh and…
ContinuePosted by Riaz Haq on April 1, 2024 at 5:00pm
Agriculture, Caste, Religion and Happiness in South Asia
Pakistan's agriculture sector GDP grew at a rate of 5.2% in the October-December 2023 quarter, according to the government figures. This is a rare bright spot in the overall national economy that showed just 1% growth during the quarter. Strong performance of the farm sector gives the much needed boost for about …
ContinuePosted by Riaz Haq on March 29, 2024 at 8:00pm
© 2024 Created by Riaz Haq.
Powered by
![]()
You need to be a member of PakAlumni Worldwide: The Global Social Network to add comments!
Join PakAlumni Worldwide: The Global Social Network