PakAlumni Worldwide: The Global Social Network
The Global Social Network
Has Bangladesh Really Left India and Pakistan Behind in Per Capita Income?
Is Bangladesh's officially reported GDP figure credible? Do consumption figures support Bangladesh's claim of higher per capita income than India and Pakistan? Is it the recent rebasing of GDP that boosted Bangladesh's per capita income above India's and Pakistan's? If Bangladesh has higher GDP per capita, why is its per capita consumption of energy, cement and steel so much lower than India's and Pakistan's? Does Pakistan really have a much larger informal economy than Bangladesh or India do? How long has it been since Pakistan rebased its GDP calculations? Is there a lot more currency in circulation in Pakistan than in Bangladesh and India? Let us try and answer these questions!
Rebasing GDP:
Bangladesh just rebased its GDP in 2020-21 to year 2015-16. This has boosted its per capita income by double digits for every year since 2015-16. Bangladesh's per capita income for the 2015-16 fiscal year has now gone up to $1,737 from $1,465 in the old calculation. For the 2019-2020 fiscal, the per capita income has gone up to $2,335 from $2,024. The new GDP estimate covers 21 sectors, up from 15 sectors previously. India last rebased its GDP in 2015, a change that bumped up its per capita GDP by double digits. Nigeria's last rebasing in 2012 increased the size of its economy (GDP) by nearly 90%. Pakistan's current base year is 2005-6. Rebasing which is now long overdue will almost certainly increase Pakistan's per capita income by double digits.
In its 2014 annual report, the State Bank of Pakistan talked about a number of new sectors that are either under-reported or not covered at all: "In terms of LSM growth, a number of sectors that are showing strong performance; (for example, fast moving consumer goods (FMCG) sector; plastic products; buses and trucks; and even textiles), are either under reported, or not even covered. The omission of such important sectors from official data coverage, probably explains the apparent disconnect between overall economic activity in the country and the hard numbers in LSM."
Pakistan's last economic census was done in 2003 and published in 2005, livestock census in 2006 and agriculture census in 2010. The country's economy has changed significantly since then, adding several new economic activities while others may have diminished. The Quantum Index of Large Scale Manufacturing (QIM) with 2005-06 base year gives a weight to textiles of 20.9% (Yarn 13.7 and cloth 7.2). But the textile industry has significantly changed as reflected in its exports. The value added textiles (non-yarn and non-cloth) now make almost 80% of the total textile exports. These changes are not reflected in current GDP calculations.
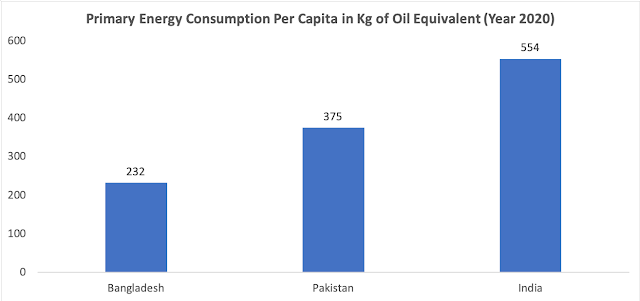 |
| Primary Energy Consumption Per Capita. Source: British Petroleum St... |
Energy consumption:
Life in modern times is heavily dependent on energy. Per capita energy consumption, a key barometer of economic activity, is significantly lower in Bangladesh than in India and Pakistan. Use of electricity per capita in Bangladesh is significantly less than in India and Pakistan.
 |
|
|
Commercial energy use (kg of oil equivalent per capita) above refers to apparent consumption, which is equal to indigenous production plus imports and stock changes, minus exports and fuels supplied to ships and aircraft engaged in international transport. It's only 142 Kg of oil per capita in Bangladesh, much lower than 463 Kg in Pakistan and 494 Kg in India.
A more recent British Petroleum "Statistical Review of World Energy 2021" puts the per capita primary energy consumption at 9.7 Gigajoules (232 kilogram of oil equivalent) for Bangladesh, 15.7 Gj (375 kgoe) for Pakistan and 23.2 Gj (554 kgoe) for India.
Per capita consumption of primary energy in Bangladesh has grown by 59% (6.1 Gj to 9.7 Gj) since 2010, much faster than 25% (18.2 Gj to 23.2 Gj) in India and just 6% (14.8 Gj to 15.7 Gj) in Pakistan, according to the British Petroleum's "Statistical Review of World Energy 2021". This indicates much faster economic growth in Bangladesh than India or Pakistan in the last decade.
Cement Consumption:
Use of cement is another important indicator of economic and development activities, particularly in the infrastructure and housing construction sector. China and the United States, the world's biggest economies, also have the highest consumption of cement.
 |
| Cement Consumption. Source: International Cement Review |
Steel Consumption:
Per capita steel consumption is another important indicator of economic activity in both construction and manufacturing sectors. It goes into building housing and infrastructure as well manufacturing vehicles and home appliances. The United States and China, the world's biggest economies, are the largest consumers of steel.
 |
| Per Capita Steel Consumption. Source: National Steel Advisory Council |
Bangladesh is among the lowest consumers of steel products in the world. Per capita consumption of finished steel in Bangladesh (41 Kg) is lower than the regional peer Myanmar (40.5), India (75.3), Pakistan (45.7), Sri Lanka (53.5), according to the World Steel Association (WSA).
Pakistan's Informal Economy:
One way to estimate the size of the informal economy in any country is by looking at the amount of currency in circulation relative to overall money supply. This data is published regularly by all central banks in South Asia and elsewhere. Pakistan's currency in circulation to M2 ratio (about 30%) is more than double the ratios in Bangladesh (13%) and India (15%), indicating that the informal economy in Pakistan is much bigger.
Dr. Lalarukh Ejaz, an assistant professor at the Institute of Business Administration in Karachi, has estimated the size of Pakistan’s informal economy at 56% of the country’s GDP (as of 2019). This means that it’s worth around $180 billion a year, and that is a massive amount by any yardstick.
Vehicles and home appliance ownership data analyzed by Dr. Jawaid Abdul Ghani of Karachi School of Business Leadership suggests that the officially reported GDP significantly understates Pakistan's actual GDP. Indeed, many economists believe that Pakistan’s economy is at least double the size that is officially reported in the government's Economic Surveys.
Back in 2014, the State Bank of Pakistan stated in its Annual Report as follows: "In terms of LSM growth, a number of sectors that are showing strong performance; (for example, fast moving consumer goods (FMCG) sector; plastic products; buses and trucks; and even textiles), are either under reported, or not even covered. The omission of such important sectors from official data coverage, probably explains the apparent disconnect between overall economic activity in the country and the hard numbers in LSM." Pakistan's GDP has not been rebased in more than a decade. It was last rebased in 2005-6 while India’s was rebased in 2011. The recent rebasing of Bangladesh GDP to year 2015 has boosted its per capita income of Bangladesh for year 2016-16 and all subsequent years . The per capita income for the 2015-16 fiscal year has now gone up to $1737 from $1465 in the old calculation For the 2019-2020 fiscal, the per capita income has gone up to $2335 from $2024. Just rebasing the Pakistani economy will result in double digit increases in GDP for the last several years.
 |
| Estimates of Informal Economies in Asia in 2012. Source: IMF A research paper by economists Ali Kemal and Ahmad Waqar Qasim of PIDE (Pakistan Institute of Development Economics) estimated in 2012 that the Pakistani economy’s size then was around $400 billion. All they did was look at the consumption data to reach their conclusion. They used the data reported in regular PSLM (Pakistan Social and Living Standard Measurements) surveys on actual living standards. They found that a huge chunk of the country's economy is undocumented.
|
 |
| Currency in Circulation to M2 Ratio Trends. Source: Business Recorder |
Pakistan's Service Sector:
Pakistan's service sector which contributes more than 50% of the country's GDP is mostly cash-based and least documented. Compared to Bangladesh and India, there is a lot more currency in circulation as a percentage of overall money supply in Pakistan. According to the State Bank of Pakistan (SBP), the currency in circulation has increased to Rs. 7.4 trillion by the end of the financial year 2020-21, up from Rs 6.7 trillion in the last financial year, a double-digit growth of 10.4% year-on-year. Currency in circulation (CIC), as percent of M2 money supply and currency-to-deposit ratio, has been increasing over the last few years. The CIC/M2 ratio is now close to 30%, according to the State Bank of Pakistan. The average CIC/M2 ratio in FY18-21 was measured at 28%, up from 22% in FY10-15. This 1.2 trillion rupee increase could have generated undocumented GDP of Rs 3.1 trillion at the historic velocity of 2.6, according to a report in The Business Recorder. In comparison to Bangladesh (CIC/M2 at 13%), Pakistan’s cash economy is double the size. Even a casual observer can see that the living standards in Pakistan are higher than those in Bangladesh and India.
 |
| Exports as Percentage of GDP in South Asia. Source: World Bank |
Exports:
Pakistan has performed poorly in exports growth relative to Bangladesh and India since about 2007. This has been the key source of its balance of payments crises and its repeated need for IMF bailouts. Pakistan's economic growth has essentially been constrained by its recurring balance of payment (BOP) crises as explained by Thirlwall's Law.
Summary:
Bangladesh just rebased its GDP in 2020-21 to year 2015-16. This has boosted its per capita income by double digits for every year since 2015-16, raising it above India's and Pakistan's. Based on published data on energy, cement and steel consumption, Bangladesh's claim of having a per capita GDP higher than India's and Pakistan's does not seem credible. In this age of growing energy-intensive industrialization, it does not make sense to have significantly lower use of key inputs like energy to produce higher gross domestic product. For Pakistan, it is important for policymakers to promote ways of documenting more of the economy. It's also important for finance officials to rebase the country's GDP to a more recent year than the year 2006 when it was last done.
Related Links:
Haq's Musings
South Asia Investor Review
Pakistan Among World's Largest Food Producers
Food in Pakistan 2nd Cheapest in the World
Indian Economy Grew Just 0.2% Annually in Last Two Years
Pakistan to Become World's 6th Largest Cement Producer by 2030
Pakistan's 2012 GDP Estimated at $401 Billion
Pakistan's Computer Services Exports Jump 26% Amid COVID19 Lockdown
Coronavirus, Lives and Livelihoods in Pakistan
Vast Majority of Pakistanis Support Imran Khan's Handling of Covid1...
Pakistani-American Woman Featured in Netflix Documentary "Pandemic"
Incomes of Poorest Pakistanis Growing Faster Than Their Richest Cou...
Can Pakistan Effectively Respond to Coronavirus Outbreak?
How Grim is Pakistan's Social Sector Progress?
Pakistan's Insatiable Appetite For Energy
Trump Picks Muslim-American to Lead Vaccine Effort
COVID Lockdown Decimates India's Middle Class
Pakistan to be World's 7th Largest Consumer Market by 2030
Pakistan's Balance of Payments Crisis
How Has India Built Large Forex Reserves Despite Perennial Trade De...
Conspiracy Theories About Pakistan Elections"
PTI Triumphs Over Corrupt Dynastic Political Parties
Strikingly Similar Narratives of Donald Trump and Nawaz Sharif
Nawaz Sharif's Report Card
Riaz Haq's Youtube Channel
Views: 846
-
Comment by Riaz Haq on December 26, 2021 at 7:37pm
-
GDP rebasing: no more delays!
https://www.brecorder.com/news/40115951
There is little doubt that the size of Pakistan’s economy is understated. Many economic indictors such as per capita income and debt levels depict bleaker picture than the situation on the ground reflects. When size of the economy is understated, it makes debt to GDP ratio appear unsustainable, in turn weakening government’s bargaining power with lenders such as IMF.
One strong indicator about economic activities in any economy is national electricity consumption. Most readers would be surprise to find out that per capita grid electricity sales are 25-30 percent higher in Pakistan than in Bangladesh. Many commentators point out that GDP per capita has become higher in Bangladesh over the last decade. But it is pertinent to note that while electricity consumption is based on actual data, GDP of any economy is based on many assumptions and estimates and is based on the level of documentation in any economy. Ergo, it would appear that the level of documentation in Bangladesh is significantly higher in Bangladesh than in Pakistan.
Yet, infrastructure and construction actives are significantly greater in Pakistan than in Bangladesh. Domestic annual cement sales in Pakistan are at 48 million tons against 33 million tons in Bangladesh; in per capita terms, the spending is 10 percent higher in Pakistan. Existing road infrastructure is also of better quality and much more extensive in Pakistan (although latter may also be an indicator of greater geographic area). Similarly, number of passenger vehicles in Pakistan – including much more pertinent, vehicle per 1000 persons – is also higher.
The purpose, of course, is not to undermine the economic performance of Bangladesh, and the significant gains made by that country in past two decades. However, it is equally important to engage in undercutting ourselves. Anecdotal evidence suggests that the widely held perceptions of smaller size of economy – exacerbated by lower growth rate in recent years – also contributes to brain drain; as skilled workers seek opportunities elsewhere due to bleak outlook.
Pakistan conducted its last GDP rebasing exercise in 2005-06. GDP rebasing becomes due every ten years, yet it has been much delayed since. Since the PTI government took office, work has been undertaken on the same for the last two years. Yet, the problem is that the post of chief statistician has been vacant for over three years. There are many sectors which have experienced mushroom growth since the last rebasing exercise was completed, and they are not fully recorded in GDP. For example, the value addition segment of textile industry is not recorded in official GDP. Similarly, packaging across many industries is not included. Economic activities is simply much greater than what the official estimation represents.
Then the undocumented cash economy is also growing fast. The velocity of money (computed as nominal GDP divided by broad money – M2) is down from the average of 2.6 during FY10-14 to 2.1 percent during FY17-21. The velocity in any country doesn’t change so abruptly. The catch lies in clamping down on cash economy. The currency in circulation kept on growing since 2015, and falling velocity implies that cash is not coming back into the system. It is turning into a mini-economy unto its own.
The excess average annual CIC (difference between the average CIC/M2 ratio in FY18-21 at 28% to FY10-15 ratio at 22%), of Rs1.2 trillion could have generated undocumented GDP of Rs3.1 trillion at the historic velocity of 2.6. In comparison to Bangladesh (CIC/M2 at 13%), Pakistan’s cash economy is double the size.
Planning ministry must bring life to the Bureaus of Statistics (PBS) and speed up GDP rebasing. Once its done, apples can be compared to apples, which can also help restore Pakistan’s negotiating position with global lenders.
-
-
Bangladesh now a $409b economy: GDP size up, growth down as new base year takes effect
Rejaul Karim Byron
Tue Nov 2, 2021 12:00 AM Last update on: Tue Nov 2, 2021 11:36 AM
https://www.thedailystar.net/business/economy/news/gdp-size-growth-...
The economic growth rates posted in recent years were revised downwards but the size of the economy expanded thanks to a new base year adopted by the Bangladesh Bureau of Statistics (BBS).
For example, Bangladesh's gross domestic product (GDP) grew at a pace of 8.15 per cent in fiscal 2018-19, the highest on record, as per the base year 2005-06. But the growth rate fell to 7.88 per cent as per the new base year of 2015-16.
For all latest news, follow The Daily Star's Google News channel.
A base year is a benchmark with reference to which national account figures such as GDP, gross domestic saving and gross capital formation are calculated.
According to the new base year, Bangladesh was an economy of Tk 34,840 billion in current prices in FY21, up 15.7 per cent from Tk 30,111 billion as per the previous base year.
In constant prices, it stood at Tk 27,939 billion in FY21 as per the new base year, up from Tk 12,072 billion as per the old base year, according to a document of the BBS.
In terms of dollars, the GDP size stood at $409 billion in the last fiscal year if Tk 85 per USD exchange rate is taken into account. Per capita income rose to $2,554 in FY21 as per the new calculation, which was $2,227 as per the old one.
Speaking to The Daily Star, Prof Shamsul Alam, state minister for planning, said the adoption of the new base year should have been done earlier.
Although economic growth has fallen as per the new base year, it has painted the real picture of the economy.
"The size of our economy is huge, and the new base year will reflect it," he said, adding that a real scenario would allow the government to make more informed policy decisions.
Zahid Hussain, a former chief economist of the World Bank's Dhaka office, also welcomed the new base year.
He said timely revisions to data on GDP and its components determine the accuracy of national account estimates and their comparability across countries.
With the finalisation of the new series, Bangladesh will be ahead of all other Saarc countries in terms of the recency of the national account's base year.
Only the Maldives (2014) and India (2011-12) come close, while Pakistan (2005-06) and Sri Lanka (2010) are well behind.
"Improved data sources increase the coverage of economic activities as new weights for growing industries reflect their contributions to the economy more accurately," said Hussain.
The last revision was done in 2013.
The size of the agriculture, industry and services sectors has expanded as per the new base year.
The new base year uses data on about 144 crops while computing the contribution of the agriculture sector to the GDP, which was 124 crops in the previous base year.
The gross value addition by the agriculture sector rose to Tk 4,061 billion in current prices in the last fiscal year, up from Tk 3,846 billion in the old estimate, the BBS document showed.
-
-
Bangladesh now a $409b economy: GDP size up, growth down as new base year takes effect
Rejaul Karim Byron
Tue Nov 2, 2021 12:00 AM Last update on: Tue Nov 2, 2021 11:36 AM
https://www.thedailystar.net/business/economy/news/gdp-size-growth-...
The industrial sector saw the addition of the data on the outputs of Ashuganj Power Station Company, North-West Power Generation Company, Rural Power Company, cold storage for food preservation, Rajshahi Wasa, and the ship-breaking industry.
In the new base year, the gross value addition of the sector stood at Tk 11,362 billion in FY21 while it was Tk 8,944 billion as per the old base year.
The BBS also carried out surveys to cover the contribution of various new services.
The data about growing ride-sharing services, privately run motor vehicles, national flag carrier Biman, private carriers US-Bangla and Novoair, private helicopter services, Bangladesh Submarine Cable Company, motion pictures, cinema halls, new banks, mobile financial services, agent banking, and private healthcare services were included.
The sector's value addition increased to Tk 18,098 billion in FY21 compared to Tk 16,144 billion from the old base year.
In a positive development, the investment-GDP ratio rose to 30.76 per cent in the last fiscal year compared to 29.92 per cent in the old base year of 2005-06.
A BBS official said the new base year would be used while calculating the GDP and other figures from now on.
-
-
South Africa has rebased its gross domestic product (GDP). The how and the why
https://theconversation.com/south-africa-has-rebased-its-gross-dome...
What is the GDP of an economy? There are three definitions. All are equivalent. GDP can be measured:
as the value of the final goods and services produced by an economy in a particular period (a year, or a quarter); or
as the sum of value added in an economy in a particular period; or
the sum of incomes in the economy in a particular period.
So why the need to periodically rebase an economy’s GDP? Because economies change over time, in particular developing ones. How often rebasing is done in a country like South Africa depends on resources and priorities. Statistics South Africa used to do rebasing exercises every five years. Rebasing was done in 1999, 2004, 2009 and 2014. It has taken a bit longer for the latest one because of the pandemic.
The frequency matters because of the structural transformation in an economy, inflation and technological progress. For instance, during the process of economic development, or of structural transformation, economies go through a process of urbanisation, where more and more people live, study, work and produce goods and services in cities. This leads to the growth of certain sectors, such as services and manufacturing which are more productive and demand more human capital compared with sectors like agriculture. The effect of this is that the relative importance of the agricultural sector diminishes as services and manufacturing increase.
This process of structural transformation is general. Countries like the US and the UK have all gone through it. South Africa is going through it right now.
The change means that the weight of particular sectors changes in the measurement of GDP. For example, if there are less and less people working in agriculture, wages in that sector will be different than five years ago. If general prices are increasing inflation has to be taken into account and fast technological progress affects prices and wages – and demand and supply of human capital – as well.
Government agencies that calculate GDPs use a base year. For instance, Statistics South Africa, before the latest rebasing, was using 2010 prices to get the real South African GDP. To get to the real GDP in 2018, the South African nominal GDP in 2018 was being multiplied by a 2010 price index.
And prices change, not only because of inflation, but also because of changes in quality. Think of an intel processor and how it has changed its speed over time, or how banking used to be done in 2010 – in the branch – and how it was done in 2018 – on the smart phone.
Nominal and real changes happen in an economy over time. Therefore the need for periodical rebasing so that the data are always accurate.
We do not expect dramatic changes attached to rebasing exercises happening every five years. South Africa is a developing economy, which has been changing and growing over time, but its growth rates are not as dramatic as say, a country like China. So, we expect some changes, but not dramatic ones.
For example, services have had substantial (but not dramatic) positive changes with the rebasing – in other words it has increased in relative size to other sectors.
To make sense of that, just think in terms of the massive developments around the city in areas such as Rosebank and Sandton. All those new buildings are being occupied by people providing services, and with human capital. In two words, structural transformation.
-
-
Arif Habib Limited
@ArifHabibLtd
During CY21, industry recorded highest ever MoGas sales of 8.6mn tons. Moreover, total industry sales surged by 19% YoY to 20.8mn tons during CY21.https://twitter.com/ArifHabibLtd/status/1478004863250440193?s=20
-
-
Arif Habib Limited
@ArifHabibLtd
During CY21, industry recorded highest ever MoGas sales of 8.6mn tons. Moreover, total industry sales surged by 19% YoY to 20.8mn tons during CY21.https://twitter.com/ArifHabibLtd/status/1478004863250440193?s=20
-------------
Arif Habib Limited
@ArifHabibLtd
Total (oil) industry sales (in Pakistan) surged by 19% YoY to 20.8mn tons during CY21.https://twitter.com/ArifHabibLtd/status/1478004887761952770?s=20
-
-
Pakistan to rebase it GDP to 2015-16
https://www.thenews.com.pk/print/915868-rebasing-of-national-accoun...
The World Bank (WB) has validated the overall methodology for conducting the rebasing exercises in Pakistan and pointed out some deficiencies in respective areas, which could be rectified within the next few days.
The Pakistan Bureau of Statistics (PBS) is ready to present the re-basing of national accounts exercise before the high-powered technical committee, Governance Council and then Economic Coordination Committee of the Cabinet (ECC).
With this exercise, some key economic indicators will be improved but some will be further worsened. For instance, with the ballooning of GDP growth, total public debt in percentage of GDP will be improved. However, the FBR’s tax-to-GDP ratio may be worsened.
"We have accomplished 36 surveys/studies out of total assigned 42 exercises for changing the base year from 2005-06 to 2015-16 to calculate figures of national accounts as it will help ballooning the overall GDP growth rate in a substantial manner,” top official sources confirmed to The News.
“The re-basing of National Accounts will be accomplished within the current fiscal year and provisional GDP growth figure for 2021-22 will be calculated on the basis of rebasing exercise."
Top official sources said there are some practical difficulties in the way of rebasing of national accounts as the PBS conducted 42 studies on various sectors of the national economy to finalise weights on the basis of the latest data compiled in the fiscal year 2015-16. The PBS conducted different studies in the last four years. Earlier, such studies were conducted by consultants through the private sector but for the first time it was being done by the PBS itself, so the quality of the done studies needs to be thoroughly scrutinized before granting approval for rebasing of national accounts on the basis of 2015-16.
The last rebasing of national accounts was done in 2005-6 during the Musharraf/Shaukat Aziz regime. Earlier, the rebasing was done in 1999-2000 after a period of 20 years, so it was decided that the rebasing exercise would be done after five years. The economic census was also done in 2005-6 and the national accounts were re-based on the basis of the same data, so it was decided that the rebasing of national accounts should be done after a period of 10 years.
The PBS captured the data on the stipulated time-frame but for accomplishing all other requirements, it took almost four years for conducting other studies. Now it is hoped that the rebasing exercise will be implemented to change the base year from 2005-6 to 2015-16 because in 10 years, there are many ground realities changed. So fresh data capturing methodology should be devised to get a more realistic picture of the national economy.
-
-
Deficient data
By Ishrat HusainDecember 24, 2021
https://www.thenews.com.pk/print/919381-deficient-data
In most countries, the national accounts are revised at intervals of five years or so. GDP at current and constant factor prices in Pakistan is still derived from the 2005-06 base, for which some of the surveys were carried out several years before the base year. The 2015-16 rebasing exercise has been completed for quite some time and is in danger of becoming redundant because of new capacity, new activities and new sectors that have emerged since these surveys were undertaken. Rebasing and extrapolation to the current year would show a substantial increase in the size of the economy, and per capita income providing a more realistic picture. Of course, the result of the rebasing is likely to lead to uproar by certain quarters as it would show decline in debt, fiscal and current account deficits/ GDP ratios and a lowering of tax, imports and exports ratios etc relative to GDP. The present ratios are misleading and do not guide policymakers in taking the right remedial actions.
----------------
Let me give one specific example of the unreliability and inaccuracy of the present data. The Quantum Index of Large Scale Manufacturing (QIM) with 2005-06 as base year gives a weight to textiles of 20.9 percent (Yarn 13.7 and cloth 7.2). If we examine the exports of textiles, the value added textiles (non-yarn and non-cloth) form almost 80 percent of the total textile exports. All the large exporting houses producing value added goods are not reflected in this weightage for LSM. So the critics rightly point out as to how exports are growing when the yarn and cloth output are declining.
The QIM is constructed in an ad-hoc manner by combining the data from the Oil Companies Advisory Committee (11 items), the Ministry of Industries and Production (36 items), and the Provincial Bureaus (65 items) reporting changes on a monthly basis in the components of the index. Not only is the methodology questionable, the coverage is also incomplete and inaccurate. The provincial bureaus – except Punjab – do not have the capacity to collect the primary information and therefore rely on the industry sources (which usually understate production to evade taxes) or secondary data.
Any correlations with the usage of inputs or electricity or gas consumption are not attempted to verify the authenticity and whatever raw data is reported goes into the index unvarnished. Decisions on export or imports of sugar were made on the basis of the production data provided by the sugar millers which subsequently was found to be erroneous. The same is the case with cement, fertilisers, automobiles etc output data that is included without validation or independent verification.
The last Census of Manufacturing Industries (CMI) which was used in the National Accounts and QMI was that of 2005-06. CMI 2015-16 was completed a few years ago and my information about Punjab shows there is quantum jump in the index compared to what we are using at present. The PBS and the Planning Commission should have made the switch but it hasn’t been done so far. This would affect our national accounts and the industry sector but also the services sector whose value added is dependent on the quantum of commodity producing sectors.
-
-
Deficient data
By Ishrat HusainDecember 24, 2021
https://www.thenews.com.pk/print/919381-deficient-data
The last economic census was held from April 2003 to December 2003 and published in 2005, agriculture census in 2010, and livestock census in 2006. These censuses are critical in estimating the intercensal growth rates and also updating the samples for surveys from which the sectoral estimates for agriculture, livestock, micro, small and medium enterprises are derived. The Mouza Census was conducted in 2020 but its findings are still awaited. How can we have any confidence in the reliability of the present estimates when the underlying universe has changed significantly during this period, adding new economic activities while others may have disappeared from the scene? In addition, there is no unified national data center where various databases can be integrated, and thus there is too much fragmentation and very little aggregation across the silos. .
--------
The ECC had taken decisions on imports and exports of wheat, and sugar based on the crop reporting system of the provincial governments and Household Income and Expenditure Survey data but both the production and consumption data kept on changing from one meeting to the other as reported in the media. If the PBS can do a fine job in rebasing, expanding coverage and providing urban and rural price indices separately of the price statistics and decision support system, it is puzzling as to why this cannot be done in the case of the National Accounts, Labour Survey, Pakistan Living Standards Measurement
The agenda on which the PBS should work in the near term is: one, announce the results of rebasing of National Accounts 2015-16 and extend the series to date keeping the old series in parallel for one year. Two, hold or complete a new economic census, agriculture census, livestock census. Three, release the results of the Census of Manufacturing Industries CMI 2015-16 immediately and the QIM reconfigured its findings. Four, publish Quarterly National Accounts and Gross Provincial Products accounts regularly. Five, redesign and carry out a labour survey data including nominal and real wages every year and its methodology, coverage and definitions brought in line with the regional countries. Six, the PSLM Survey data /HIES show a lot of gap in income and expenditure compared to National Accounts. Their design, sample size and coverage may be revisited.
-
-
Pakistan’s GDP size expands increased by 11.3%t o $346.76 billion in FY21 showing growth of 5.37%
https://www.app.com.pk/business/pakistans-gdp-size-expands-to-346-7...
The National Accounts Committee (NAC) Thursday approved the revised figures of Pakistan’s Gross Domestic Product (GDP) growth rate of 5.37% against the provisional numbers of 3.9% for the fiscal year 2020-21 (FY21).
According to the final numbers approved by the committee, the per capita increased to Rs 266,614 or US$ 1,666 in 2020-21 while the size of the economy reached to US$ 346.76 billion.
The Committee also accorded approval to the change of base of National Accounts from 2005-06 to 2015-16.
The 104th meeting of the NAC was held here under the Chairmanship of Secretary ministry of Planning, Development & Special Initiatives Abdul Aziz Uqaili.
Due to improved coverage and better estimation of input output structure of industries, the gross value addition has increased by Rs. 3.1 trillion in the base year 2015-16 from Rs. 27.4 to Rs. 30.5 trillion, showing an increase of 11.3% in the Gross Value Added (GVA) for the base year 2015-16.
This shows that in the previous base of 2005-06 economy was under estimated by 11.3%. Agriculture showed an increase of 8.3% from Rs. 6.7 to 7.3 trillion, industry grew by 11.9% from Rs. 5.3 to 5.9 trillion and services enhanced by 12.5% from Rs. 15.3 to 17.3 trillion.
With rebasing and level shift of economy from Rs. 29.1 trillion to Rs. 32.7 trillion in 2015-16, the GDP at market prices increased to 55.5 trillion in 2021, and Gross National Income increased to Rs. 59.3 trillion.
The per capita income increased to Rs 266,614 or US$ 1,666 in 2020-21. The size of the economy reached to US$ 346.76 billion.
According to a press release issued by the ministry of Planning, the Ministry and Pakistan Bureau of Statistics (PBS) have decided to devise a mechanism to rebase National Accounts as well as price statistics after every five years in line with the best practice adopted by the most of the countries of the world, as both go in tandem to capture more areas and activities, which have taken place in the last couple of years.
The PBS being a National Statistical Organization has to comply with the international standards while compiling national indicators of economy.
The methodology adopted in the re-basing is in line with the 2008 System of National Accounts (SNA). During 2014-15 to 2016-17, the PBS has conducted about 45 census, surveys, and studies to properly capture the economic activities in the country.
The results of these census, surveys, and studies have already been reviewed by internal and World Bank experts.
Efforts have been made to include new economic activities. Dedicated surveys and studies have been
conducted to capture the share of economic activities in the economy. Input output ratios of various
industries have been updated, which has resulted in better reflection of their contribution in the
economy.
Comment
- ‹ Previous
- 1
- 2
- 3
- 4
- Next ›
Twitter Feed
Live Traffic Feed
Sponsored Links
South Asia Investor Review
Investor Information Blog
Haq's Musings
Riaz Haq's Current Affairs Blog
Please Bookmark This Page!
Blog Posts
Pakistani Student Enrollment in US Universities Hits All Time High
Pakistani student enrollment in America's institutions of higher learning rose 16% last year, outpacing the record 12% growth in the number of international students hosted by the country. This puts Pakistan among eight sources in the top 20 countries with the largest increases in US enrollment. India saw the biggest increase at 35%, followed by Ghana 32%, Bangladesh and…
ContinuePosted by Riaz Haq on April 1, 2024 at 5:00pm
Agriculture, Caste, Religion and Happiness in South Asia
Pakistan's agriculture sector GDP grew at a rate of 5.2% in the October-December 2023 quarter, according to the government figures. This is a rare bright spot in the overall national economy that showed just 1% growth during the quarter. Strong performance of the farm sector gives the much needed boost for about …
ContinuePosted by Riaz Haq on March 29, 2024 at 8:00pm
© 2024 Created by Riaz Haq.
Powered by
![]()
You need to be a member of PakAlumni Worldwide: The Global Social Network to add comments!
Join PakAlumni Worldwide: The Global Social Network