PakAlumni Worldwide: The Global Social Network
The Global Social Network
Pakistan At 75: Highlights of Economic and Demographic Progress Since Independence
Pakistan is a young nation with a lot of unrealized potential. As the country turns 75, it is important to recognize that all basic indicators of progress such as income, employment, education, health, nutrition, electricity use, telecommunications and transportation have shown significant improvements over the last seven and a half decades. These improvements can be accelerated if Pakistan can overcome its economic growth constraints from recurring balance of payments crises such as the one it is experiencing now. The only way to do it is through rapid expansion of exports and major reductions in reliance on imports such as fossil fuels and cooking oil.
Income/GDP Growth:
Economic Survey of Pakistan 2021-22 confirms that the nation's GDP grew nearly 6% in fiscal year 2021-22, reaching $1.62 Trillion in terms of purchasing power parity (PPP). It first crossed the trillion dollar mark in 2017. In nominal US$ terms, the size of Pakistan's economy is now $383 billion. The country's per capita income is $1,798 in nominal terms and $7,551 in PPP dollars.
 |
| Pakistan GDP, Per Capita Income Growth. Source: 75 Years Economic J... |
Electricity Consumption:
Pakistan's electricity consumption is an important indicator of economic activity and living standards. It has soared from 40 GWH in 1949 (1 KWH per capita) to 136,572 KWH in 2021 (620 KWH per capita). Last year, hydroelectric dams contributed 37,689 GWH of electricity or 27.6% of the total power generated, making hydropower the biggest contributor to power generated in the country. It was followed by coal (20%), LNG (19%) and nuclear (11.4%). Nuclear power plants generated 15,540 GWH of electricity in 2021, a jump of 66% over 2020. Overall, Pakistan's power plants produced 136,572 GWH of power in 2021, an increase of 10.6% over 2020, indicating robust economic recovery amid the COVID19 pandemic.
 |
|
|
 |
| Installed Power Generation Capacity Growth. Source: Bilal Gilani of... |
Population Growth:
Pakistan's population has grown rapidly over the last 75 years. It is now 227 million, 6.7 times 34 million in 1951. However, the total fertility rate has declined from 6.5 babies in 1950 to 3.3 babies per woman in 2021.
 |
|
|
 |
| Pakistan Total Fertility Rate Per Woman of Child-Bearing Age. Sourc... |
 |
|
|
 |
|
|
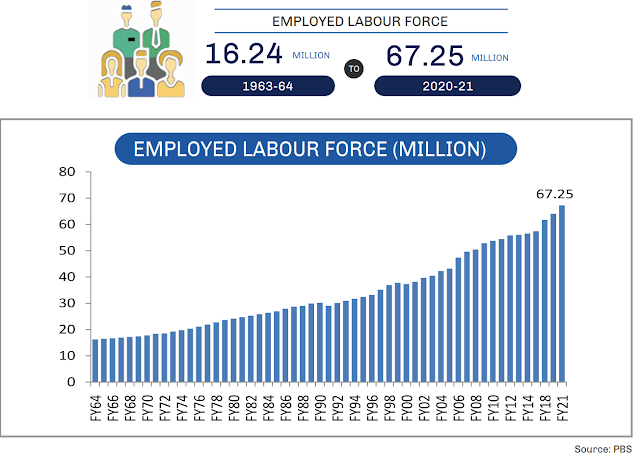
Unlike Pakistan's, India's labor participation rate (LPR) has been falling significantly in the last decade. It fell to 39.5% in March 2022, as reported by the Center for Monitoring Indian Economy (CMIE). It dropped below the 39.9% participation rate recorded in February. It is also lower than during the second wave of Covid-19 in April-June 2021. The lowest the labor participation rate had fallen to in the second wave was in June 2021 when it fell to 39.6%. The average LPR during April-June 2021 was 40%. March 2022, with no Covid-19 wave and with much lesser restrictions on mobility, has reported a worse LPR of 39.5%.
 |
| Labor Participation Rates in India and Pakistan. Source: ILO/World ... |
Youth unemployment for ages 15-24 in India is 24.9%, the highest in the South Asia region. It is 14.8% in Bangladesh and 9.2% in Pakistan, according to the International Labor Organization and the World Bank.
Pakistan has managed to significantly reduce poverty since its inception.
 |
|
|
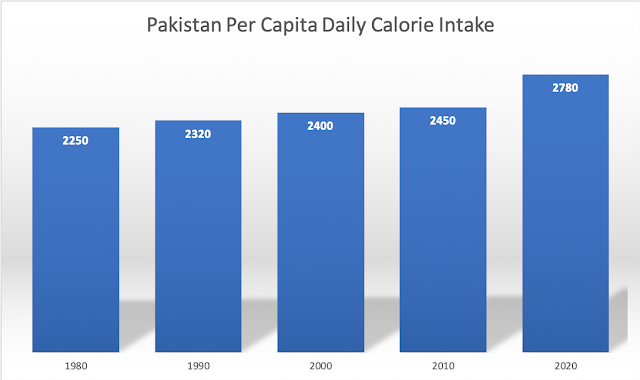
In terms of the impact of economic growth on average Pakistanis, the per capita average daily calorie intake jumped to 2,735 calories in FY 2021-22 from 2,457 calories in 2019-20. It has grown from 2250 calories in 1980 to 2780 calories in 2020.
 |
|
|
Agriculture:
Pakistan is among the world's largest food producers. It experienced broad-based economic growth across all key sectors in FY 21-22; manufacturing posted 9.8% growth, services 6.2% and agriculture 4.4%. The 4.4% growth in agriculture is particularly welcome; it helps reduce rural poverty.
 |
| Production of Tractors in Pakistan |
 |
| Wheat Production in Pakistan |
 |
| Rice Production in Pakistan |
 |
| Corn Production in Pakistan |
 |
| Sugarcane Production in Pakistan |
 |
| Meat Production in Pakistan |
 |
| Milk Production in Pakistan |
 |
| Cotton Production in Pakistan |
Literacy in Pakistan has increased from just 16.4% in 1950-51 to 62.8% in 2020-21. Male literacy is now at 73.4% but the female literacy lags at only 51.9%. The area of female literacy clearly requires greater attention and focus.
 |
| Literacy Rate in Pakistan |
 |
| University Enrollment in Pakistan |
 |
| Enrollment in Degree Colleges in Pakistan |
Telecommunications:
Telecommunication services and broadband subscriptions in Pakistan have rapidly grown, especially over the last two decades. The number of telephone and mobile users has increased from just 15,200 in 1947 to 194.2 million in 2021.
 |
| Phone Users in Pakistan |
Transportation:
Expansion of road infrastructure and increasing vehicle ownership have contributed to the growth of the road transport sector. Number of registered vehicles in Pakistan has soared from 31,892 in 1947 to 32.4 million in 2021. Road length has grown from 26,300 Km in 1947 to 500,000 Km in 2021.
| Vehicle Ownership and Road Length in Pakistan |
Pakistan has seen significant improvements in its population's living standards since independence in 1947. Average Pakistani has much higher income and greater access to food, healthcare, education, housing, transport, electricity and communication services.
Acknowledgement: Charts and data in this blog post are sourced from 75 Years Economic Journey of Pakistan published by Pakistan's Ministry of Finance.
South Asia Investor Review
Pakistan's Expected Demographic Dividend
Pakistan's Social Sector
World Bank: Pakistan Reduced Poverty, Grew Economy During Covid19 P...
Pakistan Among World's Largest Food Producers
Pakistan's Balance of Payments Crisis
Panama Leaks in Pakistan
Olive Revolution in Pakistan"
Naya Pakistan Sehat Card: A Giant Step Toward Universal Healthcare
Prime Minister Imran Khan's Effectiveness as Crisis Leader
India in Crisis: Unemployment and Hunger Persists After Waves of Covid
Riaz Haq's Youtube Channel
Views: 833
-
Comment by Riaz Haq on December 9, 2022 at 7:40am
-
Goldman Sachs analysts Kevin Daly and Tadas Gedminas project Pakistan's economy to grow to become the world's sixth largest by 2075. In a research paper titled "The Path to 2075", the authors forecast Pakistan's GDP to rise to $12.7 trillion with per capita income of $27,100. India’s GDP in 2075 is projected at $52.5 trillion and per capita GDP at $31,300. Bangladesh is projected to be a $6.3 trillion economy with per capita income of $31,000. By 2075, China will be the top global economy, followed by India 2nd, US 3rd, Indonesia 4th, Nigeria 5th and Pakistan 6th.
https://www.southasiainvestor.com/2022/12/goldman-sachs-projects-pa...
---------
The Path to 2075
https://www.goldmansachs.com/insights/pages/gs-research/the-path-to...
Country GDP % Growth Rate by decades 2000-2009 to 2070-2079
Pakistan 4.7 4.0 5.0 6.0 5.9 5.3 4.7 4.0 3.4
China 10.3 7.7 4.2 4.0 2.5 1.6 1.1 0.9 0.5
India 6.9 6.9 5.0 5.8 4.6 3.7 3.1 2.5 2.1
Korea 4.9 3.3 2.0 1.9 1.4 0.8 0.3 -0.1 -0.2
Bangladesh 5.6 6.6 6.3 6.6 4.9 3.8 3.0 2.5 2.0
---------------------
Country GDP in Trillions of U$ from 2000 to 2075
Pakistan 0.1 0.2 0.3 0.6 1.6 3.3 6.1 9.9 12.3
China 1.8 7.4 15.5 24.5 34.1 41.9 48.6 54.8 57.0
India 0.7 2.1 2.8 6.6 13.2 22.2 33.2 45.8 52.5
Korea 0.9 1.4 1.7 2.0 2.6 3.1 3.3 3.4 3.4
Bangladesh 0.1 0.2 0.4 0.8 1.7 2.8 4.1 5.5 6.3
-------------------
Country Per Capita Income in thousands of US$ by Decade-ends 2000 to 2075
Pakistan 0.9 1.3 1.4 2.2 4.8 9.0 14.9 22.5 27.1
China 1.4 5.5 10.9 17.3 24.7 31.9 40.3 50.4 55.4
India 0.7 1.7 2.0 4.3 8.2 13.3 19.6 27.1 31.3
Korea 18.7 28.8 33.0 39.3 53.6 67.7 81.8 95.2 101.8
Bangladesh 0.7 1.1 2.3 4.4 8.4 13.5 19.7 26.9 31.0
-
-
The Path to 2075
https://www.goldmansachs.com/insights/pages/gs-research/the-path-to...
The 10 years following the creation of the BRICs acronym in 2001 represented a golden
era for emerging market economic and financial market outperformance. Between the
early 2000s and the 2007/08 Global Financial Crisis (GFC), growth was unusually strong
in most economies and especially so in EMs, fuelled by exceptionally rapid globalisation.
And, while the Global Financial Crisis drove developed economies into a deep and
lengthy recession, the majority of EMs weathered that storm relatively well. For most
economies and in most respects, our first set of BRICs projections underestimated the
speed of EM convergence over the subsequent 10 years.
The same was not true for the 10 years after that. In Exhibit 7 we compare actual GDP
growth for the period 2010-2019 with our 2011 projections.4
GDP growth has undershot
our 2011 estimates by an average of 0.6 percentage points per year (based on a
PPP-weighted average). The most notable underperformers have been Russia, Brazil,
and Latin America more generally. That said, the cross-country performance has been
mixed, with the world’s two largest economies – the US and China – matching our
projections and India slightly surpassing them.
Country GDP % Growth Rate by decades 2000-2009 to 2070-2079
Brazil 3.4 1.4 1.9 2.4 2.8 2.5 2.1 1.7 1.5
Mexico 1.5 2.7 1.8 3.0 3.0 2.6 2.2 1.7 1.4
Argentina 2.6 1.4 2.6 3.3 3.1 2.6 2.2 1.8 1.5
Colombia 3.9 3.7 3.4 3.4 3.3 2.7 2.2 1.7 1.4
Chile 4.2 3.3 2.1 2.3 2.4 2.0 1.6 1.4 1.2
Peru 5.0 4.5 3.3 4.2 4.0 3.5 2.9 2.5 2.1
------------
Country Per Capita Income in thousands of US$ by Decade-ends 2000 to 2075
Brazil 5.7 13.8 7.1 10.4 15.3 21.3 28.3 36.3 40.8
Mexico 11.0 11.6 9.0 14.3 21.2 29.5 39.2 50.0 55.7
Argentina 13.0 12.7 9.0 15.2 20.9 27.2 34.5 42.5 46.7
Colombia 3.8 7.9 5.5 9.8 16.4 24.4 33.3 43.1 48.5
Chile 7.7 15.7 13.6 18.3 26.2 35.0 44.0 54.2 59.8
Ecuador 2.2 5.7 5.9 7.8 11.2 15.5 21.0 27.6 31.4
Peru 2.9 6.3 6.4 9.8 15.5 22.7 31.1 41.0 46.5
-----------
Country GDP in Trillions of U$ from 2000 to 2075
Brazil 1.0 2.7 1.5 2.3 3.5 4.9 6.4 8.0 8.7
Mexico 1.1 1.3 1.1 1.9 3.0 4.2 5.6 6.9 7.6
Argentina 0.5 0.5 0.4 0.7 1.0 1.4 1.8 2.2 2.4
Colombia 0.2 0.4 0.3 0.5 0.9 1.4 1.9 2.4 2.6
Chile 0.1 0.3 0.3 0.4 0.5 0.7 0.9 1.1 1.2
Ecuador 0.0 0.1 0.1 0.2 0.2 0.3 0.5 0.6 0.7
Peru 0.1 0.2 0.2 0.4 0.6 1.0 1.4 1.8 2.1
-
-
The Path to 2075
https://www.goldmansachs.com/insights/pages/gs-research/the-path-to...
Country GDP % Growth Rate by decades 2000-2009 to 2070-2079
Germany 0.8 2.0 0.7 1.2 1.3 1.1 0.9 0.9 1.0
France 1.5 1.4 1.2 1.7 1.5 1.3 1.2 1.2 1.1
Italy 0.5 0.3 0.9 1.4 1.0 0.7 0.6 0.5 0.5
Japan 0.5 1.2 0.6 0.9 0.8 0.7 0.7 0.6 0.5
United Kingdom 1.6 2.0 1.4 2.0 1.9 1.6 1.5 1.3 1.2
Australia 3.1 2.6 2.3 2.5 2.4 2.1 1.8 1.7 1.5
Canada 2.1 2.3 1.7 2.1 2.0 1.9 1.7 1.6 1.6
Indonesia 5.3 5.4 3.8 4.3 3.6 3.0 2.6 2.3 2.0
Thailand 4.3 3.6 1.9 2.8 2.4 1.9 1.4 1.1 0.9
Philippines 4.5 6.4 4.4 6.0 4.9 4.1 3.5 3.1 2.7
Malaysia 4.7 5.4 2.9 3.6 3.5 2.9 2.2 1.8 1.5
Russia 5.5 2.1 0.3 1.2 1.6 1.2 1.2 1.3 1.1
Turkey 4.0 5.9 4.2 3.5 2.9 2.1 1.7 1.4 1.1
Kazakhstan 8.6 4.4 2.7 3.1 3.2 2.8 2.8 2.8 2.5
South Africa 3.6 1.7 1.8 2.8 3.6 3.4 2.9 2.6 2.2
Nigeria 8.3 3.8 3.6 4.6 6.3 6.1 5.4 4.6 3.9
Ghana 5.3 6.7 4.3 5.0 5.2 4.9 4.5 4.1 3.6
Ethiopia 8.6 9.6 8.6 10.7 8.2 6.6 5.5 4.7 4.0
------
Country GDP in Trillions of U$ from 2000 to 2075
Germany 3.0 4.2 4.0 4.4 5.3 6.2 6.9 7.7 8.1
France 2.1 3.3 2.7 3.2 3.9 4.6 5.4 6.1 6.5
Italy 1.7 2.6 2.0 2.3 2.7 3.1 3.4 3.6 3.8
Japan 7.5 7.1 5.2 4.4 5.2 6.0 6.7 7.2 7.5
United Kingdom 2.5 3.1 2.9 3.3 4.3 5.2 6.1 7.1 7.6
Australia 0.6 1.5 1.4 1.8 2.3 2.8 3.3 3.9 4.3
Canada 1.1 2.0 1.7 2.3 2.8 3.4 4.1 4.8 5.2
Indonesia 0.3 0.9 1.1 2.2 4.0 6.3 9.0 12.1 13.7
Thailand 0.2 0.4 0.5 0.7 1.2 1.7 2.2 2.6 2.8
Philippines 0.1 0.3 0.4 0.7 1.4 2.5 3.9 5.6 6.6
Malaysia 0.2 0.3 0.4 0.6 1.2 1.8 2.5 3.2 3.5
Russia 0.4 2.0 1.5 2.8 3.7 4.5 5.4 6.4 6.9
Turkey 0.4 1.0 0.8 1.3 2.2 3.1 4.0 4.8 5.2
Kazakhstan 0.0 0.2 0.2 0.3 0.6 0.9 1.3 1.8 2.1
Egypt 0.2 0.3 0.4 0.8 1.9 3.5 5.8 8.8 10.4
Saudi Arabia 0.3 0.7 0.7 1.5 2.4 3.5 4.5 5.6 6.1
Pakistan 0.1 0.2 0.3 0.6 1.6 3.3 6.1 9.9 12.3
South Africa 0.2 0.5 0.4 0.5 0.9 1.4 2.1 2.8 3.3
Nigeria 0.1 0.5 0.4 0.8 1.6 3.4 6.2 10.4 13.1
Ghana 0.0 0.1 0.1 0.1 0.3 0.5 0.8 1.2 1.5
Ethiopia 0.0 0.0 0.1 0.3 0.7 1.6 2.9 4.9 6.2
-------------
Country Per Capita Income in thousands of US$ by Decade-ends 2000 to 2075
Germany 36.3 51.5 48.6 53.2 65.9 78.6 90.7 104.2 111.6
France 35.3 52.2 42.6 48.3 59.2 70.5 82.9 96.1 102.8
Italy 30.6 44.0 33.1 39.6 49.6 59.2 70.2 82.2 88.0
Japan 59.4 55.3 41.8 36.8 47.0 57.5 68.9 81.2 87.6
United Kingdom 42.9 48.9 42.9 47.9 60.2 72.5 85.7 99.8 106.6
Australia 31.9 70.1 55.1 64.4 75.1 86.7 98.8 112.3 119.4
Canada 36.8 58.6 45.2 56.4 64.7 74.5 85.4 97.0 103.1
Indonesia 1.3 3.8 4.1 7.5 12.9 19.8 28.2 38.0 43.4
Thailand 3.0 6.1 7.3 10.1 17.0 25.0 34.0 44.0 49.3
Philippines 1.6 2.7 3.4 5.5 9.9 15.7 23.1 32.1 37.3
Malaysia 6.8 11.1 10.6 17.0 29.5 44.2 59.2 75.1 83.5
Russia 2.9 14.0 10.6 19.9 27.2 34.1 42.1 52.1 57.2
Turkey 6.5 13.1 8.9 14.3 23.2 32.1 41.3 51.5 56.7
Kazakhstan 1.8 11.0 9.4 16.1 25.5 35.4 47.4 62.5 70.5
Egypt 2.2 3.2 3.7 6.3 12.9 22.0 33.5 47.1 54.6
Saudi Arabia 13.3 22.1 20.4 36.1 54.2 71.9 90.2 110.5 120.6
Pakistan 0.9 1.3 1.4 2.2 4.8 9.0 14.9 22.5 27.1
South Africa 4.9 9.9 6.0 8.0 12.9 19.3 27.3 37.2 42.6
Nigeria 0.8 2.8 2.1 2.9 5.1 8.9 14.4 22.0 26.5
Ghana 0.9 2.1 2.3 3.3 5.5 8.7 13.2 19.4 23.1
Ethiopia 0.2 0.4 0.9 1.9 4.0 7.3 11.8 18.1 21.9
-
-
The Path to 2075
https://www.goldmansachs.com/insights/pages/gs-research/the-path-to...
The 10 years following the creation of the BRICs acronym in 2001 represented a golden
era for emerging market economic and financial market outperformance. Between the
early 2000s and the 2007/08 Global Financial Crisis (GFC), growth was unusually strong
in most economies and especially so in EMs, fuelled by exceptionally rapid globalisation.
And, while the Global Financial Crisis drove developed economies into a deep and
lengthy recession, the majority of EMs weathered that storm relatively well. For most
economies and in most respects, our first set of BRICs projections underestimated the
speed of EM convergence over the subsequent 10 years.
The same was not true for the 10 years after that. In Exhibit 7 we compare actual GDP
growth for the period 2010-2019 with our 2011 projections.4
GDP growth has undershot
our 2011 estimates by an average of 0.6 percentage points per year (based on a
PPP-weighted average). The most notable underperformers have been Russia, Brazil,
and Latin America more generally. That said, the cross-country performance has been
mixed, with the world’s two largest economies – the US and China – matching our
projections and India slightly surpassing them.
Country GDP % Growth Rate by decades 2000-2009 to 2070-2079
Brazil 3.4 1.4 1.9 2.4 2.8 2.5 2.1 1.7 1.5
Mexico 1.5 2.7 1.8 3.0 3.0 2.6 2.2 1.7 1.4
Argentina 2.6 1.4 2.6 3.3 3.1 2.6 2.2 1.8 1.5
Colombia 3.9 3.7 3.4 3.4 3.3 2.7 2.2 1.7 1.4
Chile 4.2 3.3 2.1 2.3 2.4 2.0 1.6 1.4 1.2
Peru 5.0 4.5 3.3 4.2 4.0 3.5 2.9 2.5 2.1
------------
Country Per Capita Income in thousands of US$ by Decade-ends 2000 to 2075
Brazil 5.7 13.8 7.1 10.4 15.3 21.3 28.3 36.3 40.8
Mexico 11.0 11.6 9.0 14.3 21.2 29.5 39.2 50.0 55.7
Argentina 13.0 12.7 9.0 15.2 20.9 27.2 34.5 42.5 46.7
Colombia 3.8 7.9 5.5 9.8 16.4 24.4 33.3 43.1 48.5
Chile 7.7 15.7 13.6 18.3 26.2 35.0 44.0 54.2 59.8
Ecuador 2.2 5.7 5.9 7.8 11.2 15.5 21.0 27.6 31.4
Peru 2.9 6.3 6.4 9.8 15.5 22.7 31.1 41.0 46.5
-----------
Country GDP in Trillions of U$ from 2000 to 2075
Brazil 1.0 2.7 1.5 2.3 3.5 4.9 6.4 8.0 8.7
Mexico 1.1 1.3 1.1 1.9 3.0 4.2 5.6 6.9 7.6
Argentina 0.5 0.5 0.4 0.7 1.0 1.4 1.8 2.2 2.4
Colombia 0.2 0.4 0.3 0.5 0.9 1.4 1.9 2.4 2.6
Chile 0.1 0.3 0.3 0.4 0.5 0.7 0.9 1.1 1.2
Ecuador 0.0 0.1 0.1 0.2 0.2 0.3 0.5 0.6 0.7
Peru 0.1 0.2 0.2 0.4 0.6 1.0 1.4 1.8 2.1
-
-
Pakistan: Top Performing Sectors And Scrips Of 2022 – OpEd
https://www.eurasiareview.com/26122022-pakistan-top-performing-sect...
Let me and you accept the harsh reality that 2022 was a bad year for Pakistan’s capital market. Market value (market capitalization) of companies listed at Pakistan Stock Exchange (PSX) declined 17% to RKR6.4 trillion. In US$ terms it plummeted 35% to US$28 billion. Still there are some islands of excellence.
Real Estate Investment Trust (REIT), Synthetic & Rayon, and Sugar were the top performing sectors in 2022 as their market cap increased by 12%, 6% and 5% respectively, despite bad market conditions.
Technology sector was up 2% and outperformed the market despite fall in global listed technology stocks.
As against these, Engineering, Automobile Parts, and Miscellaneous sectors remained the worst performing sectors posting decline of 45%, 41% and 34% respectively.
REIT sector that has only one listed company gained in 2022 due to stable dividend yield coupled with changes in regulations on REITs investment for banks. To recall, State Bank of Pakistan (SBP) recently allowed banks to count their investments in shares issued by REIT towards achievement of housing and construction finance targets.
Synthetic & Rayon also posted strong performance led by rally in Ibrahim Fiber Limited (IBFL).
Sugar sector performance was led by JDW Sugar Mills (JDWS) that announced buy back.
Engineering sector (mainly steel related companies) was badly impacted due to economic slowdown and subdued construction activity.
Automobile parts sector also remained amongst worst performing sectors primarily due to import restrictions, high financing rates and lackluster demand.
For its analysis, Pakistan’s leading brokerage house, Topline Securities assumed sectors with minimum market capitalization of US$100 million adjusted for new listings including Adamjee Insurance (AICL), and Telecard Limited (GEMSNL).
Lotte Chemical (LOTCHEM) doubled while Airlink was down substantially in 2022. LOTCHEM was the top performing stock of the market in 2022 where the scrip gained more than 100%. Investors were excited over potential sell off by Lotte Chemical Corporation South Korea (parent company of LOTCHEM) and subsequent public offer for minority shareholders.
LOTCEHM was followed by Faysal Bank (FABL) and Unilever Pakistan Foods (UPFL). The strong stock performance by FABL is on announcement to convert into an Islamic Bank followed by a special dividend.
Similarly, UPFL stock was up 34% as the company posted strong profitability growth of 33%YoY in 9M2022.
Systems Limited (SYS), Pakistan’s largest listed IT firm remained amongst the top performing stocks for the third consecutive year as the company continued to post strong profitability growth in spite of economic challenges.
Air Link Communication (AIRLINK) declined 54% due to low profits led by lower volumetric sales.
Gul Ahmed Textile Mills (GATM) also reported decline by 52% amid slowdown in textile exports.
Searle Company Limited (SEARLE) was down 52% due to lower profits led by falling gross margins driven by significant jump in raw material cost and company’s inability to immediately pass full impact on to consumers.
-
-
69% Pakistanis feel that their children will have a better life than them in a global Gallup International survey in 64 countries
Figure in India is 43%
https://twitter.com/bilalgilani/status/1619768586276569088?s=20&...
https://www.gallup-international.bg/en/46667/fsdfdsfs/
The most positive country among those surveyed is Nigeria (90% minus 6%) and the most negative is Slovenia a (14% minus 53%). Among the prominent countries where GIA could poll, expectations for their children’s future are highest in Nigeria is followed by Russia (52% minus 10%), Mexico (48% minus 30%), the USA (43% minus 31%) and India (43% minus 33%).
When combining the two questions, another perspective is added. For instance, Moldova shows a total of 86 (45% saying that their live is worse life than the one of their parents plus 41% expecting a worse life of today’s children), followed in this negative ranking by North Macedonia (82: 35% negative assessments plus 47% negative predictions), Afghanistan (81), Syria and Italy (78), etc.
Most of the countries are still positive on both questions, but if one looks for instance for countries with both above 50% positive answers, Nigeria stands out with 171 (81% positive for today plus 90% positive for tomorrow), followed by Kosovo (162), the United Arab Emirates (150), Ghana (141), Pakistan (134), etc.
Findings are proved, confirming that developing parts of the world share more hope. National and political peculiarities leave their footprint but in general is seems that the closer the war and troubles are, the worse are the answers on both issues – as expected.
---------
Every second citizen (51%) of the world believes that their life is better than that of their parents. The other half of the people asked is equally divided between those who assess a worse life (23%) and those who find it the same (23%). 3% could not answer. Satisfaction with the living standard is a key factor for people to believe that they have a better life than their parents. But in some rich regions like Europe this is not so valid.
Expectations for the life of today’s children are predominantly good as well but lower than the comparison of own life to the life of the previous generation – 44% are expecting a better life for today’s children in comparison to our lives, 28% expecting a worse life, 20% expecting about the same and 8% not responding. Aged people are less sure about the better future of the next generation. More money unsurprisingly seems to result in more confidence in the future on a personal level, but on a national level countries that experience or used to experience difficulties are the ones to believe stronger in better future for the next generation. Unsurprisingly again.
-
-
Flour crisis deepens in Pakistan | World Grain
https://www.world-grain.com/articles/18326-flour-crisis-deepens-in-...
ISLAMABAD, PAKISTAN — Despite slight increases expected for wheat production and imports in Pakistan, consumption is forecast to outstrip supply in marketing year 2023-24 in the country with the world’s fifth largest population, according to a Global Agricultural Information Network report from the Foreign Agricultural Service of the US Department of Agriculture (USDA).
Although a slight reduction in planted area is anticipated, wheat production in Pakistan is projected to increase 2% to 27 million tonnes, with wheat yield expected to rise due to favorable weather conditions and better availability of irrigation water. However, wheat consumption is forecast to increase 3% in 2023-24, the USDA said, in one of the fastest growing countries in the world with a population of 233 million. The shortage of wheat, which accounts for 72% of Pakistan’s daily caloric intake, has caused a flour-availability and affordability crisis in Pakistan.
“High inflation has made it difficult for consumers to afford milk and meat, reversing the trend of more protein and less carbohydrates in the diet,” the USDA said. “As a result, consumption of wheat flour-based products is rebounding.”
But the supply is not rebounding at the same rate, in part due to the weather, the Russia-Ukraine war and other factors, causing many of the country’s citizens to wait in long lines in hopes of getting a bag of government-subsidized flour. Dozens of people have been trampled to death or injured in recent weeks when crowds have rushed forward to try to get the flour.
According to a recent World Food Programme report, the prices for staple cereals, pulses, and non-cereal food commodities continue to increase in Pakistan. It noted that the price of wheat flour has increased by 74% year-on-year.
“The price of wheat and wheat flour has continued to increase in the country due to various factors, including the tight supply of private wheat, hoarding and profiteering,” the WFP report said.
-
-
Assessment of macronutrients consumption in the diet of adolescent school children in four seasons: A longitudinal study from an urban city in Pakistan
https://ecommons.aku.edu/cgi/viewcontent.cgi?article=1230&conte...
Abstract Background: A healthy diet in the adolescence period is essential for physical, mental, and immunological development. We aimed to assess macronutrient consumption in the diet of adolescent school children using 24 h recalls in four seasons of the year. Method: This was a longitudinal study conducted from February 2014 to June 2015. The study population included 155 school children aged 7–14 years from an urban school in Karachi. 24HR recall was conducted on 4 random days of the 4 main seasons. A food composition table was developed where the weight, calories, carbohydrate, fat, and protein content of the food items were listed. Macronutrients quantifcation was calculated by using proportional weight from the food composition table. Food groups were also assigned to each food item including vegetables, fruits, grains, protein foods, dairy products, and oils. Results: A total of 155 adolescent children aged between 7 and 14 years were approached. Out of the 155 preadolescents and adolescents, 150 (96.7%) agreed to participate. The mean (SD) age of the children was 11.31 (1.6) years, and 59% of all the children were males. Overall mean (SD) daily intake for all seasons was 195.31 (86.87) grams of carbohydrates, 94.77 (71.87) grams of proteins, and 55.87 (30.79) grams of fats. Carbohydrates formed 48.16%, protein 21.92%, and fat 29.93% of the total caloric intake. The mean (SD) daily caloric intake was 1517 (644) grams. Overall, the highest source of calories was from carbohydrate 781 (347) Kilocalories (Kcal), followed by fat 502 (277) Kcal and protein 379 (287). The Carbohydrate intake in 24 h was highest in the autumn; 212.81 (85.37), and there was a signifcant diference in carbohydrate intake in all seasons (p value 0.003). Consumption of discretionary food group was high (31.3%), and consumption of fruits and vegetables was low (29%). Conclusion: The study reports a suboptimal caloric intake of fewer than 2000 cal/day among the adolescents from school. The highest source of calories was from carbohydrates.The highest consumption of food was in autumn and the least in summer. Fruits and vegetable intake was low, and discretionary food intake was high.
-
-
The wheat production (in Pakistan) this year topped 27.5 million metric tons, the highest in the last 10 years, despite the challenges posed by heavy rains and floods last year, the Prime Minister’s Office said in a statement on Sunday.
https://tribune.com.pk/story/2414418/pm-hails-bumper-wheat-crop
Chairing a review meeting on the wheat situation, Prime Minister Shehbaz Sharif directed the relevant federal government institutions as well as the provinces to increase their procurement quotas in the wake of a bumper crop.
According to the Prime Minister’s Office, the meeting received a briefing on the wheat production, current reserves, carry-forward reserves, procurement targets, and progress of federal and provincial departments.
Shehbaz applauded the record wheat production, saying that this achievement made possible by the grace of Allah, quality seeds, uninterrupted supply of fertiliser, and the timely decisions of the government and its Farmers Package.
“The bumper crop of wheat is a testament to the government’s timely decisions and excellent governance,” he said. “Looking forward, the government is preparing a strategy to increase wheat production even further next year,” he added.
“With the government’s continued efforts and the dedication of farmers, Pakistan aims to maintain its position as a leading wheat producer,” he said, congratulating the farmers for their hard work and dedication to achieve the milestone despite financial difficulties.
He noted that Pakistan became a wheat importing country due to the mismanagement of the previous Pakistan Tehreek-e-Insaf (PTI) government. The PTI government, he added, made farmers to stand in long queues for fertilisers.
He urged the federal and provincial institutions to increase procurement targets to enable uninterrupted supply of wheat throughout the year. He also instructed that the resources required to obtain the specified quantity of wheat should be provided through banks.
He congratulated Food Security Minister Tariq Bashir Cheema and the officials concerned, and directed all institutions to increase their targets. The meeting was also attended by the caretaker Punjab minister for industries, and other senior officials.
-
-
20 Largest Economies in the World by 2050: The Rising Giants
https://www.southwestjournal.com/largest-economies-in-the-world/
Complete List
Country Projected GDP at PPP (in trillion)
Vietnam $3.18
Philippines $3.34
South Korea $3.54
Iran $3.90
Pakistan $4.24
Egypt $4.33
Nigeria $4.35
Saudi Arabia $4.69
France $4.71
Turkey $5.18
United Kingdom $5.37
Germany $6.14
Japan $6.78
Mexico $6.86
Russia $7.13
Brazil $7.54
Indonesia $10.5
United States $34.1
India $44.1
China $58.5
---------
In our exploration of the future, we’ve delved into the fascinating realm of global economic dynamics, forecasting the 20 largest economies by the year 2050. But if you’re eager to cut to the chase, feel free to jump straight to our top 5 predictions.
Our journey begins in the heart of London, at the headquarters of our own professional services network.
We’re proud to stand among the world’s leading accountancy firms, and in 2017, we embarked on a bold project: The World in 2050. This report was our attempt to gaze into the crystal ball of the world’s economic future, three decades down the line.
Our projections suggest a seismic shift in the global economic landscape. We anticipate the global economy will surge by 130% by 2050, with China commanding a 20% share of the world’s GDP in purchasing power parity.
------------
Pakistan Forecasted GDP at PPP: $4.24 trillion
Pakistan, the world’s fifth most populous nation, is expected to be among the 20 largest economies in the world by 2050, driven by its youthful population. A Goldman Sachs report from December 2022 even tipped Pakistan to be the sixth largest economy by 2075.
Comment
- ‹ Previous
- 1
- …
- 3
- 4
- 5
- Next ›
Twitter Feed
Live Traffic Feed
Sponsored Links
South Asia Investor Review
Investor Information Blog
Haq's Musings
Riaz Haq's Current Affairs Blog
Please Bookmark This Page!
Blog Posts
Pakistani Student Enrollment in US Universities Hits All Time High
Pakistani student enrollment in America's institutions of higher learning rose 16% last year, outpacing the record 12% growth in the number of international students hosted by the country. This puts Pakistan among eight sources in the top 20 countries with the largest increases in US enrollment. India saw the biggest increase at 35%, followed by Ghana 32%, Bangladesh and…
ContinuePosted by Riaz Haq on April 1, 2024 at 5:00pm
Agriculture, Caste, Religion and Happiness in South Asia
Pakistan's agriculture sector GDP grew at a rate of 5.2% in the October-December 2023 quarter, according to the government figures. This is a rare bright spot in the overall national economy that showed just 1% growth during the quarter. Strong performance of the farm sector gives the much needed boost for about …
ContinuePosted by Riaz Haq on March 29, 2024 at 8:00pm
© 2024 Created by Riaz Haq.
Powered by
![]()
You need to be a member of PakAlumni Worldwide: The Global Social Network to add comments!
Join PakAlumni Worldwide: The Global Social Network