PakAlumni Worldwide: The Global Social Network
US Census Update: Pakistani-Americans' Average Annual Household Earnings Estimated at $150,000
The average annual household earnings of Pakistani-Americans are $149,178, according to the latest update issued by the United States Census Bureau for 2022. The update estimates the median income of 132,958 Pakistani-American households at $106,281. Average is calculated by adding up all incomes and dividing it by total number of households. Median income level divides the top 50% of families from the bottom 50%. It shows that Pakistani-American household incomes are roughly at par with the Asian-American households' median of $104,646 and average of $149,363. The highest income ethnic group in the US are Asian Indian households with a median of $152,341 and average of $197,732. Asians are significantly richer than Whites (mean $78,636, average $112,415) and African Americans (mean $52,238, average $76,888). The word "alone" in the labels in the following table excludes mixed race households.
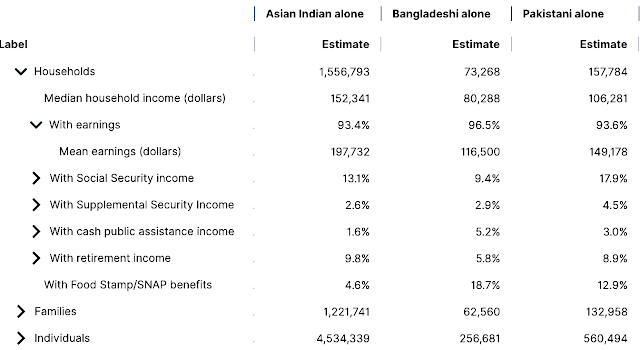 |
| South Asian Americans Households. Source: US Census Update 2022 |
Asian Americans are the best educated racial group in the United States. From 2012 to 2022, the percentage of adults age 25 and older with a bachelor’s degree or more increased from 34.5% to 41.8% for the non-Hispanic White population; from 21.2% to 27.6% for the Black population; from 51% to 59.3% for the Asian population; and from 14.5% to 20.9% for the Hispanic population, according to the US Census.
 |
| Educational Attainment By Racial Groups (Source: US Census) |
Among Asian Americans, the Indians (three quarters) have the highest educational attainment with at least a bachelor's degree, followed by Koreans and Pakistanis (about 60%), followed by the rest.
 |
| Asian American Educational Achievement by Countries of Origin. Source: US Census |
Asians, including Chinese/Taiwanese, Indians and Pakistanis, tend to be concentrated in STEM (Science, Technology, Engineering and Technology) fields where incomes are generally much higher than in other occupations.
As of 2019, there were 35,000 Pakistan-born STEM workers in the United States, according to the American Immigration Council. They included information technologists, software developers, engineers and scientists. These figures do not include medical doctors and healthcare workers.
 |
| Foreign-Born STEM Workers in America. Source: American Immigration Council |
Foreign-born workers make up a growing share of America's STEM workforce. As of 2019, foreign-born workers made up almost a quarter of all STEM workers in the country. This is a significant increase from 2000, when just 16.4% of the country’s STEM workforce was foreign-born. Between 2000 and 2019, the overall number of STEM workers in the United States increased by 44.5 percent, from 7.5 million to more than 10.8 million, according to American Immigration Council.
 |
| India and Pakistan Among Top 10 Countries Receiving US Immigrant Visas. Source: Visual Capitalist |
India topped the top 10 list of foreign-born STEM workers with 721,000, followed by China (273,000), Mexico (119,000), Vietnam (100,000), Philippines (87,000), South Korea (64,000), Canada (56,000), Taiwan (53,000), Russia (45,000) and Pakistan (35,000). Enormous number of Indian STEM workers in the United States can at least partly be attributed to the fact that India's "body shops" have mastered the art of gaming the US temporary work visa system. Last year, Indian nationals sponsored by "body shops" like Cognizant, Infosys and TCS received 166,384 H1B visas for work in the United States. By comparison, only 1,107 Pakistanis were granted H1B visas in Fiscal Year 2022. In addition to H1B work visas, 9,300 Indian nationals and 7,200 Pakistani nationals received immigrant visas to settle in the United States as permanent residents in 2021.
 |
|
|
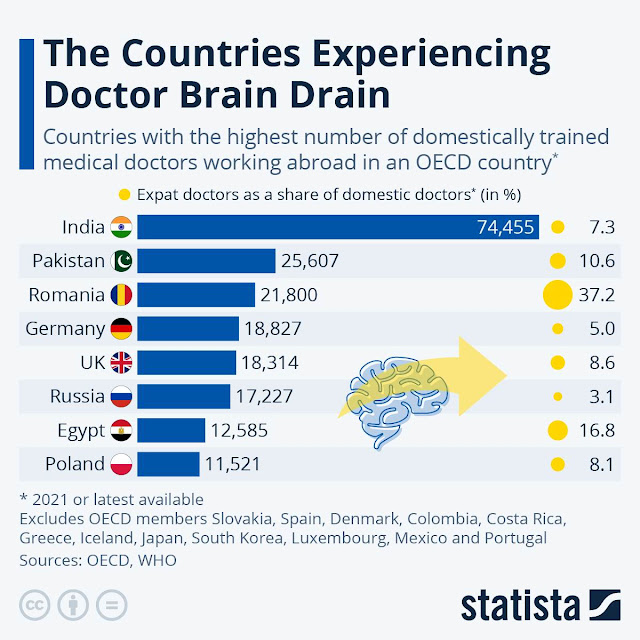
In addition to 35,000 Pakistan-born STEM workers, there were 12,454 Pakistan-born and Pakistan-trained medical doctors practicing in the United States, making the South Asian nation the second largest source of medical doctors in America. Pakistan produced 157,102 STEM graduates last year, putting it among the world's top dozen or so countries. About 43,000 of these graduates are in information technology (IT).
 |
| H1B Visas Issued in Pakistan. Source: Visagrader.com |

Every year, applicants sponsored by Indian body shops claim the lion's share of H1B visas. In 2022, Indians received 166,384 new H1B visas, accounting for nearly three quarters of all such visas issued by the US government. The figures reported as India IT exports are in fact the wages earned by millions of Indian H1B workers in the United States.
Many developing countries are experiencing brain drain. But India is losing its best brightest at a much faster rate than others. Some call it "The Great Indian Brain Drain". This is the reason why Indians in the United States are the best educated and the highest earning group. In a recently published book titled "The Other One Percent", authors Sanjoy Chakravorty, Devesh Kapur and Nirvikar Singh explain this phenomenon.
They write that the vast majority of Indians who migrate to the United States are from privileged backgrounds in terms of caste, class and education. They have gone through “a triple selection” process that gave Indian-Americans a boost over typically poor and uneducated immigrants who come to the United States from other countries. The first two selections took place in India. As explained in the book: “The social system created a small pool of persons to receive higher education, who were urban, educated, and from high/dominant castes.” India’s examination system then selected individuals for specialized training in technical fields that also happened to be in demand in the United States. Kapur estimated that the India-American population is nine times more educated than individuals in the home country. Here's an excerpt of it:
"A major focus of this book is on demonstrating and understanding the multiple selections that shaped the Indian-American population. These selections applied not only to education (that, in terms of attaining college degrees, made the India-born population three times more educated than that in the host country and nine times more educated than the home country’s population) but also to class and caste (favoring, by large margins, the “upper” and dominant classes and castes of India), profession (engineering, IT, and health care), and both the region of origin (Gujarati and Punjabi were overrepresented in the first two phases, and Telugu and Tamil in the third phase) and region of settlement (in specific metropolitan clusters in and around New York City, the San Francisco Bay Area, Chicago, Washington, D.C., and Houston and Dallas). In addition to direct selection is what we call the “selection+” advantage: we suggest that group characteristics or norms, such as the fact that Indians had the highest propensity to live in married-couple households of any major immigrant group, added to the advantages of being an already selected group. We show, in particular, how family norms were useful in keeping the Indian-American poverty level low (under 5 percent) and family income high (the highest in the United States). It is also likely that the selection process enabled, without explicitly intending to, the generation of high levels of social capital (through linguistic/ professional networks such as Gujarati entrepreneurs in the hotel industry, Telugu and Tamil workers in the IT industry, IIT engineers, Malayali nurses, Bengali academics, etc.)"
Related Links:
2021: A Banner Year For Tech Startups in Pakistan
Pakistani-Americans in Academia
Top One Percent: Are Hindus the New Jews in America?
Growing Share of Working Age Population in Pakistan
Pakistan Scientific Output is World's Fastest Growing
India's Chandrayaan 3 Success: Can Pakistanis Explore Space?
Digital Pakistan 2022
Pakistan's Large and Growing Civil Nuclear Program
Riaz Haq's Youtube Channel
Riaz Haq
From 2012 to 2022, the percentage of adults age 25 and older with a bachelor’s degree or more increased from 34.5% to 41.8% for the non-Hispanic White population; from 21.2% to 27.6% for the Black population; from 51% to 59.3% for the Asian population; and from 14.5% to 20.9% for the Hispanic population.
https://www.census.gov/newsroom/press-releases/2023/educational-att....
---------------
Over three-quarters of the Asian Indian (76.3%) and over half of the Korean (59.3%), Pakistani (58.2%), Chinese except Taiwanese (56.5%), and Japanese populations *53.5%) had a bachelor’s degree or higher.
The Cambodian (24.2%), Vietnamese (32.1%) and Hmong (23.6%) alone and alone or in any combination populations had the largest shares of high school diploma (or equivalency) attainment only.
https://www.census.gov/library/stories/2023/06/detailed-characteris...
Oct 22, 2023
Riaz Haq
Social Realities of Indian Americans: Results From the 2020 Indian American Attitudes Survey - Carnegie Endowment for International Peace
https://carnegieendowment.org/2021/06/09/social-realities-of-indian...
Thirty percent of non-citizen IAAS respondents possess a green card (or a permanent residency card), which places them on a pathway to gaining U.S. citizenship. Twenty-seven percent are H-1B visa holders, a visa status for high-skilled or specialty workers in the United States that has historically been dominated by the technology sector. On average, an H-1B visa holder reports living in the United States for eight years, although 36 percent of H-1B beneficiaries report spending more than a decade in the country (that is, they arrived before 2010). Eighteen percent of non-citizens reside in the United States on an H-4 visa, a category for immediate family members of H-1B visa holders. Fourteen percent of non-citizens are on F-1, J-1, or M-1 visas—categories of student or scholar visas—while another 5 percent hold an L-1 visa, a designation available to employees of an international company with offices in the United States. A small minority of non-citizen respondents—6 percent—claim some other visa status.
------------------------
The overwhelming majority of Hindus with a caste identity—more than eight in ten—self-identify as belonging to the category of General or upper caste.
Oct 31, 2023
Riaz Haq
Excerpts from "They Called Us Exceptional" by Prachi Gupta (pp. 7-8) . Crown. Kindle Edition.
White America crafted a tempting story to explain the ascent of Asian Americans—“an important racial minority pulling itself up from hardship and discrimination to become a model of self-respect and achievement,” as a 1966 article in U.S. News & World Report described Chinese Americans. Those once seen as “Yellow Peril” and “Dusky Peril” became a “model minority,” creating a new racial category: Asians were those who could assimilate into whiteness but maintain a distinct cultural identity. In America, riches await, and with a little grit, anyone can reap them. The story tempered the racial progress of the civil-rights era, as if to tell Black people: If those Asians can be so successful, why can’t you? Racism was a part of America’s sordid past. The success of these new Asians proved that. Indian Americans have since been allotted a specific prominence within the context of this story. In 2009, the year I graduated from college, an article in Forbes declared Indian Americans “the new model minority,” hailing families like ours as “the latest and greatest ‘model.’ ” Within a little more than a generation, Indian Americans have become one of the wealthiest and most highly educated immigrant groups in the country, earning a median income of more than one hundred thousand dollars. The steep ascent of Indian Americans reified the pernicious model-minority myth. They called us exceptional. We fulfilled their prophecy. But the story of our subcommunity’s rise wasn’t one of genetics, nor can it simply be explained by work ethic, as pundits may have one believe. The true story, as described in The Other One Percent: Indians in America, is largely due to a rigorous but invisible selection process that often begins in India itself. In India’s highly stratified society, middle- and upper-class Indians from dominant castes typically access the best schools and jobs that feed into opportunities in America, which favor immigrants who bring specialized skills in tech and science. The result: an American diasporic community that is roughly nine times more educated than Indians in India. These conditions enabled Indian families like ours—families that had been thrice-filtered and stratified—to prosper like few other immigrant groups have ever done in America. Even though pockets of Indian Americans still struggle, this insular group has become the poster image for America’s post-racial fantasy.
Sep 28, 2024