PakAlumni Worldwide: The Global Social Network
The Global Social Network
India in Crisis: Unemployment and Hunger Persist After Waves of COVID
India lost 6.8 million salaried jobs and 3.5 million entrepreneurs in November alone. Many among the unemployed can no longer afford to buy food, causing a significant spike in hunger. The country's economy is finding it hard to recover from COVID waves and lockdowns, according to data from multiple sources. At the same time, the Indian government has reported an 8.4% jump in economic growth in the July-to-September period compared with a contraction of 7.4% for the same period a year earlier. This raises the following questions: Has India had jobless growth? Or its GDP figures are fudged? If the Indian economy fails to deliver for the common man, will Prime Minister Narendra Modi step up his anti-Pakistan and anti-Muslim rhetoric to maintain his popularity among Hindus?
 |
| Labor Participation Rate in India. Source: CMIE |
Unemployment Crisis:
India lost 6.8 million salaried jobs and its labor participation rate (LPR) slipped from 40.41% to 40.15% in November, 2021, according to the Center for Monitoring Indian Economy (CMIE). In addition to the loss of salaried jobs, the number of entrepreneurs in India declined by 3.5 million. India's labor participation rate of 40.15% is lower than Pakistan's 48%. Here's an except of the latest CMIE report:
"India’s LPR is much lower than global levels. According to the World Bank, the modelled ILO estimate for the world in 2020 was 58.6 per cent (https://data.worldbank.org/indicator/SL.TLF.CACT.ZS). The same model places India’s LPR at 46 per cent. India is a large country and its low LPR drags down the world LPR as well. Implicitly, most other countries have a much higher LPR than the world average. According to the World Bank’s modelled ILO estimates, there are only 17 countries worse than India on LPR. Most of these are middle-eastern countries. These are countries such as Jordan, Yemen, Algeria, Iraq, Iran, Egypt, Syria, Senegal and Lebanon. Some of these countries are oil-rich and others are unfortunately mired in civil strife. India neither has the privileges of oil-rich countries nor the civil disturbances that could keep the LPR low. Yet, it suffers an LPR that is as low as seen in these countries".
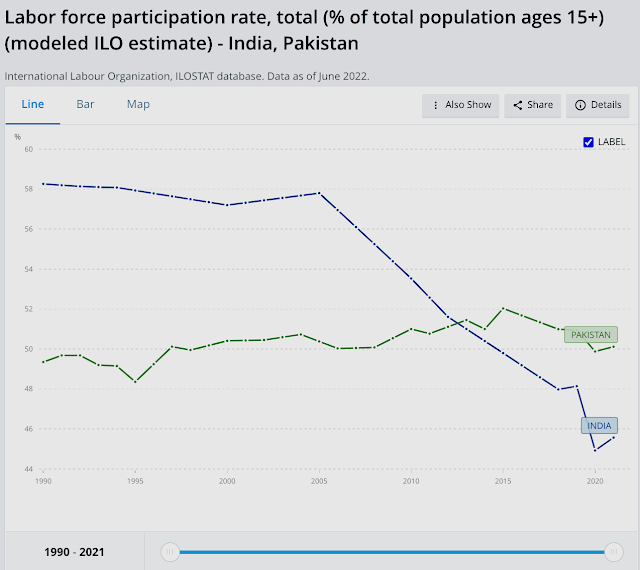 |
| Labor Participation Rates in India and Pakistan. Source: World Bank... |
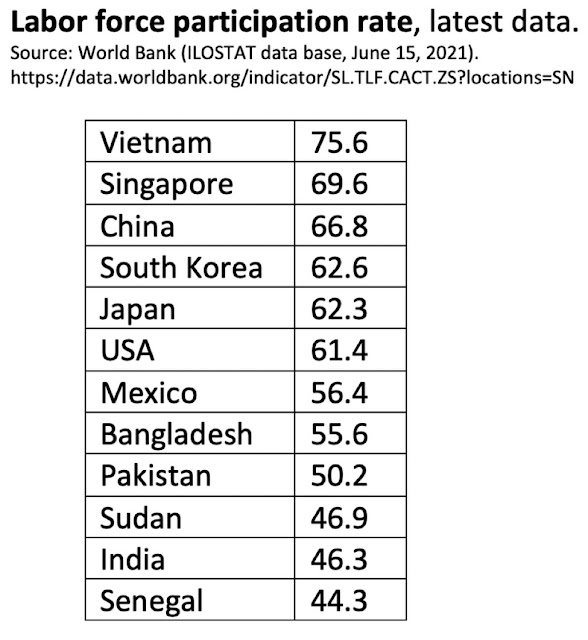 |
| Labor Participation Rates for Selected Nations. Source: World Bank/ILO |
Youth unemployment for ages15-24 in India is 24.9%, the highest in South Asia region. It is 14.8% in Bangladesh 14.8% and 9.2% in Pakistan, according to the International Labor Organization and the World Bank.
 |
| Youth Unemployment in Bangladesh, India and Pakistan. Source: ILO, WB |
In spite of the headline GDP growth figures highlighted by the Indian and world media, the fact is that it has been jobless growth. The labor participation rate (LPR) in India has been falling for more than a decade. The LPR in India has been below Pakistan's for several years, according to the International Labor Organization (ILO).
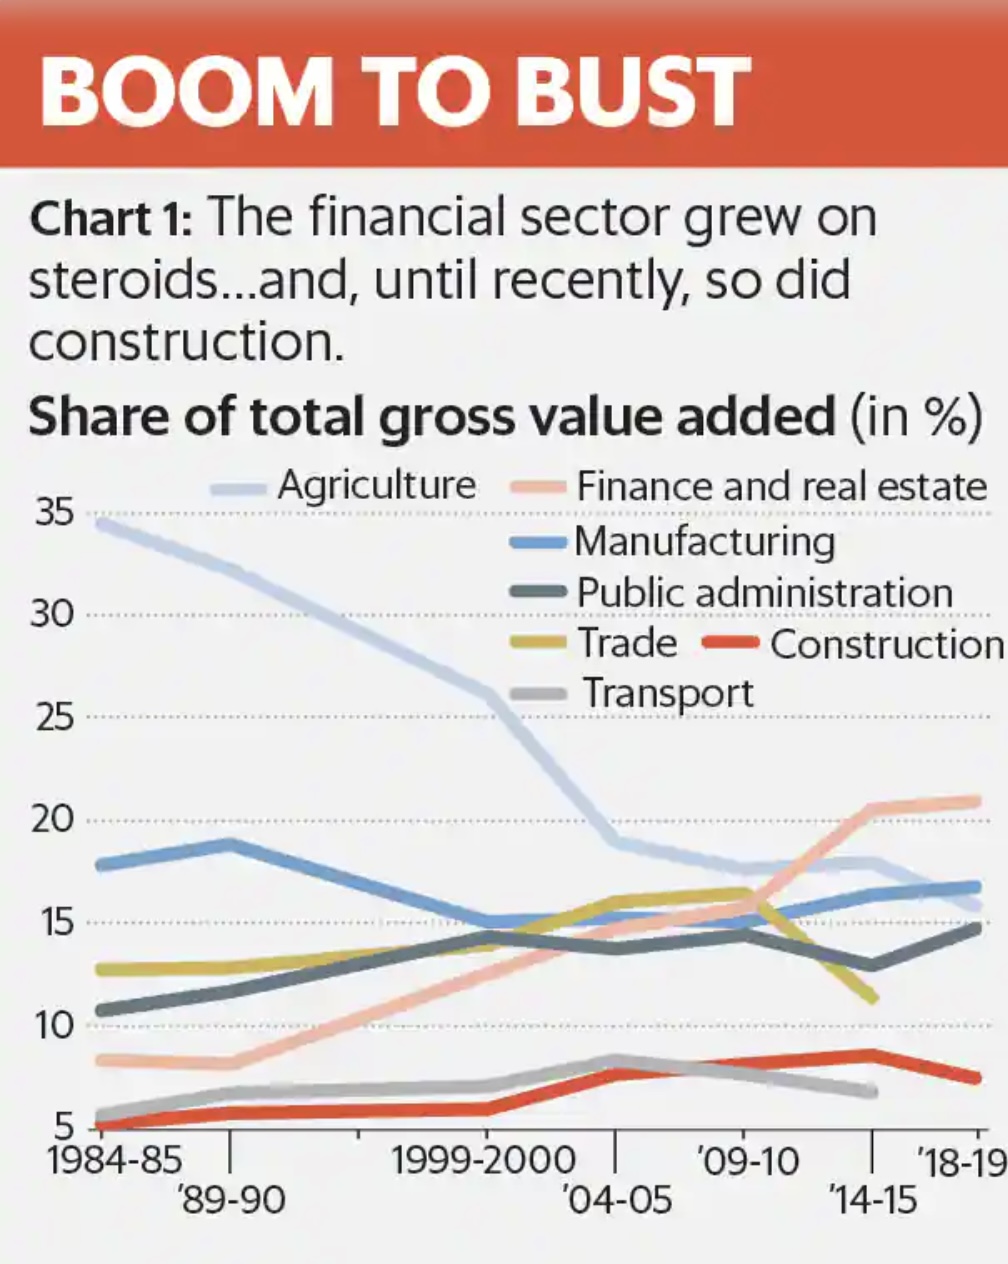 |
| Indian GDP Sectoral Contribution Trend. Source: Ashoka Mody |
 |
| Indian Employment Trends By Sector. Source: CMIE Via Business Standard |
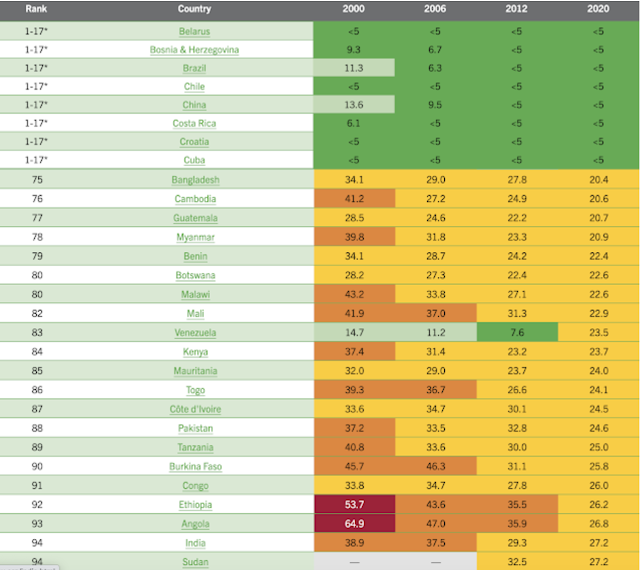 |
| World Hunger Rankings 2020. Source: World Hunger Index Report |
Hunger and malnutrition are worsening in parts of sub-Saharan Africa and South Asia because of the coronavirus pandemic, especially in low-income communities or those already stricken by continued conflict.

India has performed particularly poorly because of one of the world's strictest lockdowns imposed by Prime Minister Modi to contain the spread of the virus.
Hanke Annual Misery Index:

Pakistan's Real GDP:
Vehicles and home appliance ownership data analyzed by Dr. Jawaid Abdul Ghani of Karachi School of Business Leadership suggests that the officially reported GDP significantly understates Pakistan's actual GDP. Indeed, many economists believe that Pakistan’s economy is at least double the size that is officially reported in the government's Economic Surveys. The GDP has not been rebased in more than a decade. It was last rebased in 2005-6 while India’s was rebased in 2011 and Bangladesh’s in 2013. Just rebasing the Pakistani economy will result in at least 50% increase in official GDP. A research paper by economists Ali Kemal and Ahmad Waqar Qasim of PIDE (Pakistan Institute of Development Economics) estimated in 2012 that the Pakistani economy’s size then was around $400 billion. All they did was look at the consumption data to reach their conclusion. They used the data reported in regular PSLM (Pakistan Social and Living Standard Measurements) surveys on actual living standards. They found that a huge chunk of the country's economy is undocumented.
Pakistan's service sector which contributes more than 50% of the country's GDP is mostly cash-based and least documented. There is a lot of currency in circulation. According to the State Bank of Pakistan (SBP), the currency in circulation has increased to Rs. 7.4 trillion by the end of the financial year 2020-21, up from Rs 6.7 trillion in the last financial year, a double-digit growth of 10.4% year-on-year. Currency in circulation (CIC), as percent of M2 money supply and currency-to-deposit ratio, has been increasing over the last few years. The CIC/M2 ratio is now close to 30%. The average CIC/M2 ratio in FY18-21 was measured at 28%, up from 22% in FY10-15. This 1.2 trillion rupee increase could have generated undocumented GDP of Rs 3.1 trillion at the historic velocity of 2.6, according to a report in The Business Recorder. In comparison to Bangladesh (CIC/M2 at 13%), Pakistan’s cash economy is double the size. Even a casual observer can see that the living standards in Pakistan are higher than those in Bangladesh and India.
Related Links:
Haq's Musings
South Asia Investor Review
Pakistan Among World's Largest Food Producers
Food in Pakistan 2nd Cheapest in the World
Indian Economy Grew Just 0.2% Annually in Last Two Years
Pakistan to Become World's 6th Largest Cement Producer by 2030
Pakistan's 2012 GDP Estimated at $401 Billion
Pakistan's Computer Services Exports Jump 26% Amid COVID19 Lockdown
Coronavirus, Lives and Livelihoods in Pakistan
Vast Majority of Pakistanis Support Imran Khan's Handling of Covid1...
Pakistani-American Woman Featured in Netflix Documentary "Pandemic"
Incomes of Poorest Pakistanis Growing Faster Than Their Richest Cou...
Can Pakistan Effectively Respond to Coronavirus Outbreak?
How Grim is Pakistan's Social Sector Progress?
Pakistan Fares Marginally Better Than India On Disease Burdens
Trump Picks Muslim-American to Lead Vaccine Effort
COVID Lockdown Decimates India's Middle Class
Pakistan Child Health Indicators
Pakistan's Balance of Payments Crisis
How Has India Built Large Forex Reserves Despite Perennial Trade De...
Conspiracy Theories About Pakistan Elections"
PTI Triumphs Over Corrupt Dynastic Political Parties
Strikingly Similar Narratives of Donald Trump and Nawaz Sharif
Nawaz Sharif's Report Card
Riaz Haq's Youtube Channel
Views: 2051
-
Comment by Riaz Haq on August 28, 2022 at 5:19pm
-
GHI scores are calculated using a three-step process that draws on available data from various sources to capture the multidimensional nature of hunger (Figure A.1).
First, for each country, values are determined for four indicators:
UNDERNOURISHMENT: the share of the population that is undernourished (that is, whose caloric intake is insufficient);
CHILD WASTING: the share of children under the age of five who are wasted (that is, who have low weight for their height, reflecting acute undernutrition);
CHILD STUNTING: the share of children under the age of five who are stunted (that is, who have low height for their age, reflecting chronic undernutrition); and
CHILD MORTALITY: the mortality rate of children under the age of five (in part, a reflection of the fatal mix of inadequate nutrition and unhealthy environments).
Second, each of the four component indicators is given a standardized score on a 100-point scale based on the highest observed level for the indicator on a global scale in recent decades.
Third, standardized scores are aggregated to calculate the GHI score for each country, with each of the three dimensions (inadequate food supply; child mortality; and child undernutrition, which is composed equally of child stunting and child wasting) given equal weight (the formula for calculating GHI scores is provided in Appendix B).
This three-step process results in GHI scores on a 100-point GHI Severity Scale, where 0 is the best score (no hunger) and 100 is the worst. In practice, neither of these extremes is reached. A value of 0 would mean that a country had no undernourished people in the population, no children younger than five who were wasted or stunted, and no children who died before their fifth birthday. A value of 100 would signify that a country’s undernourishment, child wasting, child stunting, and child mortality levels were each at approximately the highest levels observed worldwide in recent decades. The GHI Severity Scale shows the severity of hunger—from low to extremely alarming—associated with the range of possible GHI scores.
BOX 1.1
WHAT IS MEANT BY “HUNGER”?
The problem of hunger is complex, and different terms are used to describe its various forms.
Hunger is usually understood to refer to the distress associated with a lack of sufficient calories. The Food and Agriculture Organization of the United Nations (FAO) defines food deprivation, or undernourishment, as the consumption of too few calories to provide the minimum amount of dietary energy that each individual requires to live a healthy and productive life, given that person’s sex, age, stature, and physical activity level.
Undernutrition goes beyond calories and signifies deficiencies in any or all of the following: energy, protein, and/ or essential vitamins and minerals. Undernutrition is the result of inadequate intake of food in terms of either quantity or quality, poor utilization of nutrients due to infections or other illnesses, or a combination of these factors. These, in turn, are caused by a range of factors, including household food insecurity; inadequate maternal health or childcare practices; or inadequate access to health services, safe water, and sanitation.
Malnutrition refers more broadly to both undernutrition (problems caused by deficiencies) and overnutrition (problems caused by unbalanced diets, such as consuming too many calories in relation to requirements with or without low intake of micronutrient-rich foods).
In this report, “hunger” refers to the index based on four component indicators. Taken together, the component indicators reflect deficiencies in calories as well as in micronutrients.
https://www.globalhungerindex.org/about.html#:~:text=The%20average%....
-
-
Not just Global Hunger Index, India’s own govt data shows how worried we should be
The Modi government has questioned the methodology of the Global Hunger Index. But undernutrition is one of the leading factors of child mortality in India.
https://theprint.in/opinion/not-just-global-hunger-index-indias-own...
The Global Hunger Index 2021 is basically about undernutrition. It provides us an opportunity to introspect on why India’s performance is not as good as what our economic growth should have ensured. Rather than doing that, the Narendra Modi government has chosen to question the methodology of one particular indicator used in the report to assess the level of undernourishment. It is true that at its core, the Hunger Index is primarily an indicator of child undernutrition and mortality. While it does estimate the prevalence of undernourishment (PoU), its weightage in the index is only one third. The other three components of the index relate to the percentage of children under five years who show wasting, stunting, and child mortality (percentage of children who die before reaching five years of age). Dipa Sinha has explained the methodology of index in this article in The Hindu.
India collects its own data on health and nutrition that is widely considered to be credible and extremely useful. The fifth round of the National Family Health Survey was conducted in 2019-20 and its findings were released in December 2020. However, data for Uttar Pradesh, Punjab, Jharkhand, and Madhya Pradesh was not included in the first phase so the all-India performance is not yet known. The survey found that the progress is worse than expected, and stunting, reflective of chronic malnutrition, has increased in 11 out of the 17 states surveyed. Wasting, indicative of acute malnutrition, has also increased in 13 of these 17 states. Such malnourished children are more vulnerable to illness and disease. The percentage of underweight children has gone up in 11 of the 17 states. In Bihar and Gujarat, 40 per cent of children under the age of five, were underweight.
Undernutrition is one of the leading risk factors for child mortality in India, accounting for 68.2 per cent of total under-five deaths (10.4 lakh) in 2017. Children with severe undernutrition are at high risk of dying from diarrhoea, pneumonia, and malaria.
https://theprint.in/opinion/not-just-global-hunger-index-indias-own...
-
-
Releasing targets for curbing malnutrition in the country, specifically among children, Union Women and Child Development Minister Smriti Irani on Wednesday said in a written statement tabled in Rajya Sabha said that it aims at reducing stunting and under-nutrition (underweight prevalence) among children under 6 years by 2% per annum.
https://indianexpress.com/article/india/over-35-5-kids-stunted-govt...
The (Indian) ministry stated that it aims to reduce low birth weight by 2% per annum, and anaemia among children between six and 59 months, as well as women and adolescent girls from 15 to 49 years, by 3% per annum.
According to findings of the 2019-21 National Family Health Survey (NFHS-5), nutrition indicators for children under 5 have improved over NFHS-4 (2015-16).
Stunting (in India) has reduced from 38.4% to 35.5%, wasting from 21.0% to 19.3% and underweight prevalence is down from 35.8% to 32.1%, according to the data. Women (15-49 years) whose BMI is below normal has reduced from 22.9% in NFHS-4 to 18.7% in NFHS-5. Despite the decrease, nutrition experts have said that India has one of the highest burdens of malnutrition in the world.
According to data released on Wednesday, Meghalaya has the highest number of stunted children (46.5%), followed by Bihar (42.9%). Assam, Dadra and Nagar Haveli, Gujarat, Jharkhand, Madhya Pradesh and Uttar Pradesh have stunted children higher than the national average of 35.5%.
Puducherry and Sikkim have the lowest percentage of stunted children, data shows.
Explained |India’s role in UN Peacekeeping Missions over the years
Maharashtra has 25.6% wasted children (weight for height) — the highest — followed by Gujarat (25.1%).
Assam, Bihar, Dadra and Nagar Haveli, Karnataka and West Bengal have a higher percentage of wasted children than the national average of 19.3%.
Bihar has the highest number of underweight children (41%), followed by Gujarat (39.7%), and Jharkhand at (39.4%).
Assam, Dadra and Nagar Haveli, Karnataka, Madhya Pradesh, Maharashtra and Uttar Pradesh have a higher percentage of underweight children than the national average of 32.1%.
The NFHS-5 data shows that Jharkhand has the highest percentage of women, between 15 and 49 years, who have a below-normal Body Mass Index (BMI), a value derived from mass and height of a person, and an indicator of under-nutrition. More than 26% Jharkhand women have below-normal BMI, the national average being 18.5%.
Bihar, Chhattisgarh, Gujarat, Madhya Pradesh, Maharashtra and Odisha also have high percentages of undernourished women.
The Supplementary Nutrition Programme under Anganwadi Services and POSHAN Abhiyaan have been converged to form the ‘Saksham Anganwadi and POSHAN 2.0’ (Mission Poshan 2.0), which seeks to address the challenges of malnutrition in children, adolescent girls, pregnant women and lactating mothers.
-
-
A comparison of international and national references to measure the prevalence of stunting in Pakistani school-age girls
https://www.nature.com/articles/s41598-022-09511-3
Epidemiology of stunting in < 5 years old is well characterized; however, its prevalence in adolescence is inconsistent in different geographical locations. We estimated the prevalence of stunting in schoolgirls of Punjab, Pakistan, to standardize local references according to international and national references. In this population-wide cross-sectional study, 10,050 schoolgirls aged 8–16 years from 12 different districts of northern, central, and southern Punjab were analyzed. The prevalence of stunting was calculated by applying Centres for Disease Control and Prevention (CDC) and World Health Organisation (WHO) height-for-age references and the local reference for the study population. We used Cohen’s kappa statistics to analyze the agreement of our data with reference values, and chi-square test was used as the test of trend. Marked overestimation of the prevalence of stunting was observed (22.72% and 17.49% according to CDC and WHO, respectively) in comparison to local reference (4.94%). According to CDC and WHO references, there was an increasing trend of prevalence of stunting with higher age; however, data was comparable across all the age groups when local references were applied. We recommend that the prevalence of stunting in school-age girls should be determined by applying local height references rather than international ones to plan health strategies and treatments in the local population.
--------
The mean age of 10,050 schoolgirls included in this study was 12.7 ± 2.29 years (Mean ± SD). The overall prevalence of stunting in the study population using two international references is described in Fig. 1A. Overall, the percentage of girls with normal height in different age groups under study was quite similar (77.28% and 82.51%, respectively). The prevalence of stunted girls in our study cohort was 22.72% and 17.49%, according to CDC and WHO, respectively. The prevalence of stunting was similar for younger girls (8, 9 years) according to CDC and WHO, higher among girls of 10–12 years according to WHO compared to CDC and highest among girls of 13–16 years of age according to CDC compared to WHO reference (Table 1, Fig. 1A). When we applied the local height-for-age cut-offs obtained from our study population, a significantly higher percentage of the girls had standard height (95.06%, p ˂ 0.05, Table 1). The overall prevalence of stunting was markedly lower (4.94%, p ˂ 0.05, Fig. 1A) in all age groups when using the local reference, compared to CDC and WHO references. However, among 8-year-old girls, the prevalence of stunting was comparable to all the three references applied. A notable finding was the increasing trend of prevalence of stunting with increasing age when CDC and WHO references were applied. However, no such trend was observed when the local cut-offs were applied (Fig. 1A). We compared the height values obtained from our cumulative study cohort with CDC and WHO references and used kappa correlation to assess the degrees of agreement between these references and local references. There was poor agreement between the local reference in comparison with CDC and WHO (κ = 0.163, 0.325 respectively) references.
-
-
‘Diet of Average Indian Lacks Protein, Fruit, Vegetables’
On average, the Indian total calorie intake is approximately 2,200 kcals per person per day, 12 per cent lower than the EAT-Lancet reference diet's recommended level.https://www.india.com/lifestyle/diet-of-average-indian-lacks-protei...
Compared to an influential diet for promoting human and planetary health, the diets of average Indians are considered unhealthy comprising excess consumption of cereals, but not enough consumption of proteins, fruits and vegetables, said a new study.Also Read - Autistic Pride Day 2020: Diet Rules For Kids With Autism
The findings by the International Food Policy Research Institute (IFPRI) and CGIAR research program on Agriculture for Nutrition and Health (A4NH) broadly apply across all states and income levels, underlining the challenges many Indians face in obtaining healthy diets.
“The EAT-Lancet diet is not a silver bullet for the myriad nutrition and environmental challenges food systems currently present, but it does provide a useful guide for evaluating how healthy and sustainable Indian diets are,” said the lead author of the research article, A4NH Program Manager Manika Sharma. Also Read - Experiencing Hair Fall? Include These Super-foods in Your Daily Diet ASAP
“At least on the nutrition front we find Indian diets to be well below optimal.”
The EAT-Lancet reference diet, published by the EAT-Lancet Commission on Food, Planet, and Health, implies that transforming eating habits, improving food production and reducing food wastage is critical to feed a future population of 10 billion a healthy diet within planetary boundaries.
While the EAT-Lancet reference diet recommends eating large shares of plant-based foods and little to no processed meat and starchy vegetables, the research demonstrates that incomes and preferences in India are driving drastically different patterns of consumption.
-
-
#Modi says bhajans (#Hindu religious songs) will cure #malnutrition. Over 35% of #Indian children are stunted, 19.3% wasted & 32.5% underweight.
BJP rule has seen undernourished population increase from 14.9% to 15.5% of population https://science.thewire.in/health/narendra-modi-malnutrition-bhajan/ via @TheWireScience
In the 92nd episode of ‘Mann ki Baat’, Prime Minister Narendra Modi said conducting bhajans can be part of the solutions to reducing malnutrition.
Cultural and traditional practices are not harmful. But it is in bad faith to make them part of habits that sideline tested and approved solutions to crucial welfare issues.
The statement also distracts from the fact that in Modi’s time as prime minister, India has come to account for a quarter of all undernourished people worldwide
There is much evidence in the public domain that says the availability, accessibility and affordability of good-quality food is crucial to improve the nutritional and health status of India’s people. There is nothing, however, about bhajans.
Many scholars and scientists have often criticised Prime Minister Modi for his irrational claims on many occasions. Reminiscent of his “taali, thali and Diwali” campaign as the COVID-19 pandemic was gaining strength, Modi’s comment on bhajans only distracts from the dire importance of effective public health measures – even as the rate of improvement of some important indicators have slid in his time at the helm.
Cultural and traditional practices are not harmful. But it is in bad faith to make them part of habits that sideline tested and approved solutions to crucial welfare issues.
In his monologue, Modi narrated a story of how people of a community in Madhya Pradesh each contribute a small quantity of grains, using which a meal is prepared for everyone one day a week. However, he shifted the focus at this point to devotional music in bhajan–kirtans – organised under the ‘Mera Bachha’ campaign – instead of dwelling on the role of Indigenous food cultures. This is counterproductive.
More malnourished children
India’s National Family Health Surveys (NFHS) and Comprehensive National Nutrition Surveys have documented the high prevalence of malnutrition and micronutrient deficiency among India’s children, adolescents and women. The recently published NFHS-5 results reported a high prevalence of stunting, wasting and underweightedness among children younger than five years and that they have declined only marginally in the last five years.
--------
A public-health approach to malnutrition requires us to pay attention to a large variety of socioeconomic conditions. In this regard, while many of Prime Minister Modi’s other comments in his monologue are well-taken, especially about public participation, neither the need for context-specific interventions nor for evidence-based policies are served by misplaced allusions to bhajans and kirtans.
-
-
Ritesh Kumar Singh
@RiteshEconomist
We shouldn't get carried away by 13.5% #GDPgrowth in Q1 FY2022/23.
Q1FY2020/21: INR 35.5 trillion
Q1FY2022/23: INR 36.85 trillion
The increase in 3 years: INR 1.35 trillion or 3.9% in 3 years.
#economy #India #IndiaAt75
@EconomicTimes
https://twitter.com/RiteshEconomist/status/1564989770966523905?s=20...
--------
Q1 GDP growth misses estimates despite low base; govt spending subdued
13.5% expansion in June QTR despite low base; GVA at basic prices up 12.7%
https://www.business-standard.com/article/economy-policy/q1-gdp-gro...
Keeping the two pandemic years of 2020 and 2021 out, Q1 real GDP in 2022-23 is only 3.8 per cent higher than in the equivalent quarter of 2019-20. Gross value added (GVA) at basic prices grew at 12.7 per cent in the June quarter while nominal GDP was up 26.7 per cent, reflecting elevated inflationary pressures in the economy.
Growth in private final consumption expenditure, or private spending, grew at a robust 25.9 per cent with pent-up demand kicking in as consumers felt confident to spend. Government spending, however, grew only 1.3 per cent, signalling that both the Central and state governments kept their expenditure in check during the quarter.
Gross fixed capital formation (GFCF), which represents investment demand in the economy, grew at a robust 20.1 per cent. However, compared to the pre-pandemic period of FY20, GFCF grew only 6.7 per cent.
On the supply side, manufacturing grew by a disappointing 4.8 per cent. Despite 25.7 per cent growth in trade, hotel, transport services, the sector, with the highest contribution to GDP, is still 15.5 per cent below the pre-pandemic level of the equivalent quarter in FY20.
The labour-intensive construction sector grew 16.8 per cent but it is barely above the pre-pandemic level, growing 1.2 per cent.
Madhavi Arora, lead economist, Emkay Global Financial Services, said. “We maintain growth may remain at 7 per cent for the year, albeit with downside risks. Going ahead, even as recovery in domestic economic activity is yet to be broad-based, global drags in the form of still elevated prices, shrinking corporate profitability, demand-curbing monetary policies and diminishing global growth prospects weigh on the growth outlook.”
Nikhil Gupta, chief economist of Motilal Oswal, said assuming no change in projections by the RBI for the rest of the year, the first-quarter data suggested the central bank’s FY23 growth forecast would be revised to 6.7 per cent from 7.2 per cent.
The RBI expected 16.2 per cent growth in Q1, with 6.2, 4.1, and 4 per cent growth in the subsequent quarters.
Aurodeep Nandi, India economist and vice-president at Nomura, said even if one were to discount the low base, this marked a stellar rise in sequential momentum with post-pandemic tailwinds lifting GDP growth in the June quarter.
-
-
Why Is Urban India Hungry For Nutrition
http://bwhealthcareworld.businessworld.in/article/Why-Is-Urban-Indi...
More than two billion people globally suffer from ‘hidden hunger’, simply put, micronutrient deficiencies. Protein, calcium, iron, zinc and essential vitamins such as Vit D, Vit B12 that the body requires to function
For the longest time, hunger has been associated with the poor. Malnutrition is a term, we are all used to by now, especially in developing nations. However, the sound of ‘urban hunger’ may ring an unfamiliar bell in most ears. The urbanites or city dwellers are known for access and affordability yet there is a growing hunger for nutrition being cited in research today.
As per the comprehensive National Nutrition survey (CNNS 2016-2018) conducted by the Ministry of Health and Family Welfare, the percentage of the population with iron deficiency has been reported to be highest at 27 per cent in the richest sector for both 5-9 and 10-19 years of Indian children and adolescents. Same is the case with Folate, Vit D, Vit B12, and Zinc deficiency.
More than two billion people globally suffer from ‘hidden hunger’, simply put, micronutrient deficiencies. Protein, calcium, iron, zinc and essential vitamins such as Vit D, Vit B12 that the body requires to function. To put it in a closer-home perspective, it could be 7 out of 10 Indians. India has recorded a triple burden of malnutrition with 189 million suffering from undernutrition, 135 million impacted by over nutrition and a whopping 700 million lacking some form of micronutrient deficiency.
Despite being highlighted as one the most cost-effective investments for human development, progress on addressing micronutrient deficiencies or mind has not shown an upward trend in recent years.
Hidden hunger does not allow children to reach their growth potential. 22 per cent of children and adolescents remain affected by stunting or low height for age and 24 per cent by wasting or low weight for height. The key micronutrient gap is not only a problem of the poor but also a big problem for middle and rich households; the problem deteriorates as kids grow older. This is also one of the reasons for instances of non-communicable diseases (NCDs) like diabetes, cardiovascular diseases, and hypertension is on the rise among adolescents.
India is a predominantly cereal-consuming nation and lacks a balanced diet. Keep in mind that Indian meals are big but not balanced, with big gaps in nutrient density. Fussy eating in younger children and unhealthy eating habits in older children are fueling gaps in nutrient intake, leading to poor nutritional status and early onset of NCDs.
Some more facts or key nutrition concerns cited by national data sets:
5 vital micronutrient deficiencies reported in both urban and rural children between 1-
19 years
One in 2 adolescents suffer from at least 2/5 micronutrient deficiencies – (Iron,
Folate, B12, Vitamin D, Vitamin A and Zinc)
Protein intake, especially in terms of quality, is still a big concern. Diets are
predominantly carbohydrate centric and lack diversity from dairy, pulses etc.
Bioavailability especially of minerals like iron, zinc is poor from a plant-based diet
Consumption of animal-based foods- milk, meat, eggs still low in the country leading
to poor nutritional status in nutrients like protein, iron, zinc, vitamin B12 etc.
Also, there is increased consumption of salt and sugar in the country along with junk foods or packaged foods, or outside food. Data shows increased consumption of 119 per cent more salt than the WHO recommendation and 180 per cent more sugar than the prescribed limit. The world of nutrition is still greek to Indian consumers which hinders their purchase choices.
The impact of this unsolved burden of malnutrition is huge. It leads to loss of productivity, illness, and increased healthcare costs, even may prove to be fatal with a loss of a minimum of 1 per cent of India’s GDP, approximately Rs.160K cr.
-
-
Food Sources
Meats, poultry, and seafood are richest in heme iron. Fortified grains, nuts, seeds, legumes, and vegetables contain non-heme iron. In the U.S. many breads, cereals, and infant formulas are fortified with iron.
https://www.hsph.harvard.edu/nutritionsource/iron/#:~:text=Food%20S....
Iron is an important mineral that helps maintain healthy blood. A lack of iron is called iron-deficiency anemia, which affects about 4-5 million Americans yearly. [1] It is the most common nutritional deficiency worldwide, causing extreme fatigue and lightheadedness. It affects all ages, with children, women who are pregnant or menstruating, and people receiving kidney dialysis among those at highest risk for this condition.
Iron is a major component of hemoglobin, a type of protein in red blood cells that carries oxygen from your lungs to all parts of the body. Without enough iron, there aren’t enough red blood cells to transport oxygen, which leads to fatigue. Iron is also part of myoglobin, a protein that carries and stores oxygen specifically in muscle tissues. Iron is important for healthy brain development and growth in children, and for the normal production and function of various cells and hormones.
Iron from food comes in two forms: heme and non-heme. Heme is found only in animal flesh like meat, poultry, and seafood. Non-heme iron is found in plant foods like whole grains, nuts, seeds, legumes, and leafy greens. Non-heme iron is also found in animal flesh (as animals consume plant foods with non-heme iron) and fortified foods.
Iron is stored in the body as ferritin (in the liver, spleen, muscle tissue, and bone marrow) and is delivered throughout the body by transferrin (a protein in blood that binds to iron). A doctor may sometimes check blood levels of these two components if anemia is suspected.
--------
Sources of heme iron:
Oysters, clams, mussels
Beef or chicken liver
Organ meats
Canned sardines
Beef
Poultry
Canned light tuna
Sources of non-heme iron:
Fortified breakfast cereals
Beans
Dark chocolate (at least 45%)
Lentils
Spinach
Potato with skin
Nuts, seeds
Enriched rice or bread
-
-
Kaushik Basu
@kaushikcbasu
India’s unemployment rate in August shot up to 8.3%. This is the highest in 12 months, according to CMIE data. This is causing extra hardship because it is happening amidst high inflation. This is where we need to focus all policy attention.
https://twitter.com/kaushikcbasu/status/1565898149415321603?s=20&am...
--------------
https://unemploymentinindia.cmie.com/
-----------------
India's unemployment rate surged to a one-year high of 8.3 per cent in August as employment sequentially fell by 2 million to 394.6 million, according to data from the Centre for Monitoring Indian Economy (CMIE).
During July, the unemployment rate was at 6.8 per cent and the employment was 397 million, the CMIE data added.
"The urban unemployment rate is usually higher at about 8 per cent than the rural unemployment rate, which is usually around 7 per cent. In August the urban unemployment rate shot up to 9.6 per cent and rural unemployment rate also increased to 7.7 per cent," CMIE managing director Mahesh Vyas told PTI.
Vyas further stated that erratic rainfall affected sowing activities and this is one of the reasons for the increase in unemployment in rural India.
The unemployment rate in rural India rose from 6.1 per cent in July to 7.7 per cent in August. More importantly, the employment rate fell from 37.6 per cent to 37.3 per cent.
"Going forward, the rural unemployment rate may come down as delayed monsoon will increase agricultural activities towards the end of the monsoon season. However, it is not clear how the urban unemployment rate will play out in the coming months. Currently, it is quite elevated," Vyas added.
During August, the unemployment was the highest in Haryana at 37.3 per cent followed by Jammu and Kashmir at 32.8 per cent, Rajasthan at 31.4 per cent, Jharkhand at 17.3 per cent and Tripura at 16.3 per cent, according to the data.
While the unemployment was the lowest in Chhattisgarh at 0.4 per cent followed by Meghalaya at 2 per cent, Maharashtra at 2.2 per cent and Gujarat and Odisha at 2.6 per cent each, the data showed.
https://www.business-standard.com/article/current-affairs/india-s-u...
Twitter Feed
Live Traffic Feed
Sponsored Links
South Asia Investor Review
Investor Information Blog
Haq's Musings
Riaz Haq's Current Affairs Blog
Please Bookmark This Page!
Blog Posts
Pakistani International Students Flocking to European Universities
Recent data shows that there are nearly 10,000 Pakistani students attending colleges and universities in Germany. This figure is second only to the United Kingdom which issued over 35,000 student visas to Pakistanis in 2024. The second most popular destination for Pakistani students is Australia which is hosting nearly 24,000 students from Pakistan as of 2023, according to the ICEF…
ContinuePosted by Riaz Haq on July 15, 2025 at 9:00am
Pakistani Prosthetics Startup Aiding Gaza's Child Amputees
While the Israeli weapons supplied by the "civilized" West are destroying the lives and limbs of thousands of Gaza's innocent children, a Pakistani startup is trying to provide them with free custom-made prostheses, according to media reports. The Karachi-based startup Bioniks was founded in 2016 and has sold prosthetics that use AI and 3D scanning for custom designs. …
ContinuePosted by Riaz Haq on July 8, 2025 at 9:30pm
© 2025 Created by Riaz Haq.
Powered by
![]()
You need to be a member of PakAlumni Worldwide: The Global Social Network to add comments!
Join PakAlumni Worldwide: The Global Social Network