PakAlumni Worldwide: The Global Social Network
The Global Social Network
India in Crisis: Unemployment and Hunger Persist After Waves of COVID
India lost 6.8 million salaried jobs and 3.5 million entrepreneurs in November alone. Many among the unemployed can no longer afford to buy food, causing a significant spike in hunger. The country's economy is finding it hard to recover from COVID waves and lockdowns, according to data from multiple sources. At the same time, the Indian government has reported an 8.4% jump in economic growth in the July-to-September period compared with a contraction of 7.4% for the same period a year earlier. This raises the following questions: Has India had jobless growth? Or its GDP figures are fudged? If the Indian economy fails to deliver for the common man, will Prime Minister Narendra Modi step up his anti-Pakistan and anti-Muslim rhetoric to maintain his popularity among Hindus?
 |
| Labor Participation Rate in India. Source: CMIE |
Unemployment Crisis:
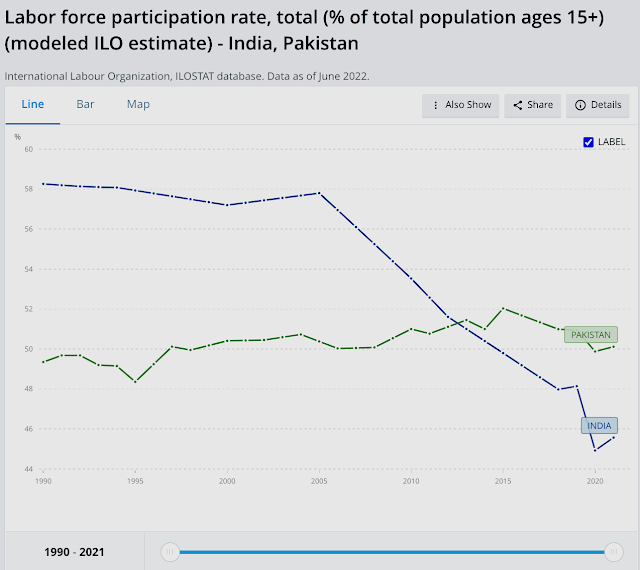
India lost 6.8 million salaried jobs and its labor participation rate (LPR) slipped from 40.41% to 40.15% in November, 2021, according to the Center for Monitoring Indian Economy (CMIE). In addition to the loss of salaried jobs, the number of entrepreneurs in India declined by 3.5 million. India's labor participation rate of 40.15% is lower than Pakistan's 48%. Here's an except of the latest CMIE report:
"India’s LPR is much lower than global levels. According to the World Bank, the modelled ILO estimate for the world in 2020 was 58.6 per cent (https://data.worldbank.org/indicator/SL.TLF.CACT.ZS). The same model places India’s LPR at 46 per cent. India is a large country and its low LPR drags down the world LPR as well. Implicitly, most other countries have a much higher LPR than the world average. According to the World Bank’s modelled ILO estimates, there are only 17 countries worse than India on LPR. Most of these are middle-eastern countries. These are countries such as Jordan, Yemen, Algeria, Iraq, Iran, Egypt, Syria, Senegal and Lebanon. Some of these countries are oil-rich and others are unfortunately mired in civil strife. India neither has the privileges of oil-rich countries nor the civil disturbances that could keep the LPR low. Yet, it suffers an LPR that is as low as seen in these countries".
 |
| Labor Participation Rates in India and Pakistan. Source: World Bank... |
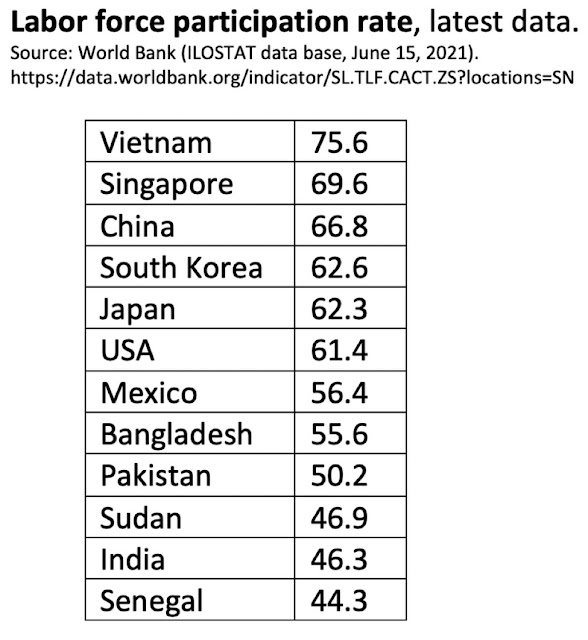 |
| Labor Participation Rates for Selected Nations. Source: World Bank/ILO |
Youth unemployment for ages15-24 in India is 24.9%, the highest in South Asia region. It is 14.8% in Bangladesh 14.8% and 9.2% in Pakistan, according to the International Labor Organization and the World Bank.
 |
| Youth Unemployment in Bangladesh, India and Pakistan. Source: ILO, WB |
In spite of the headline GDP growth figures highlighted by the Indian and world media, the fact is that it has been jobless growth. The labor participation rate (LPR) in India has been falling for more than a decade. The LPR in India has been below Pakistan's for several years, according to the International Labor Organization (ILO).
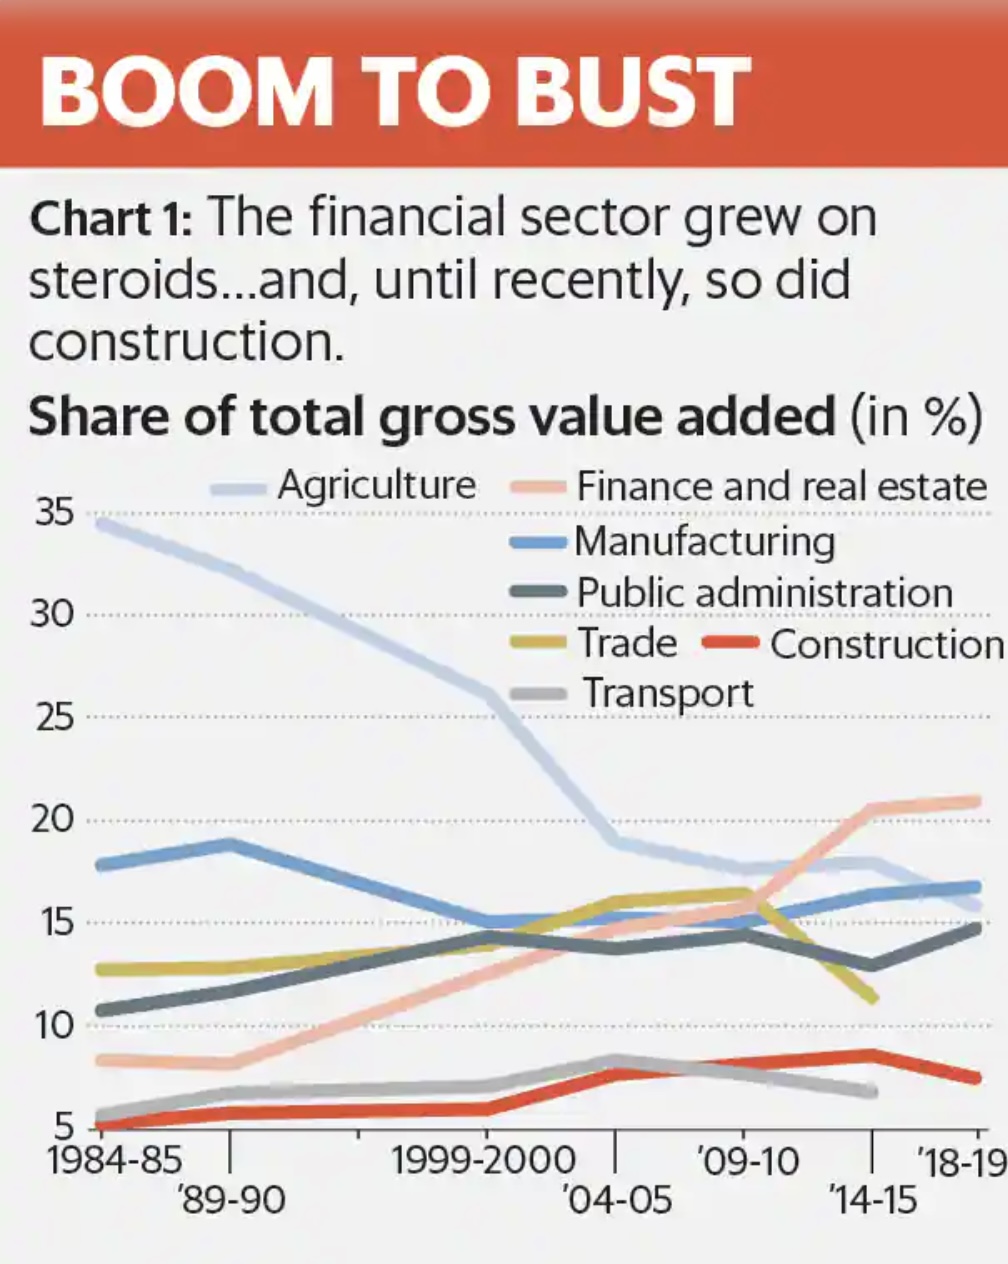 |
| Indian GDP Sectoral Contribution Trend. Source: Ashoka Mody |
 |
| Indian Employment Trends By Sector. Source: CMIE Via Business Standard |
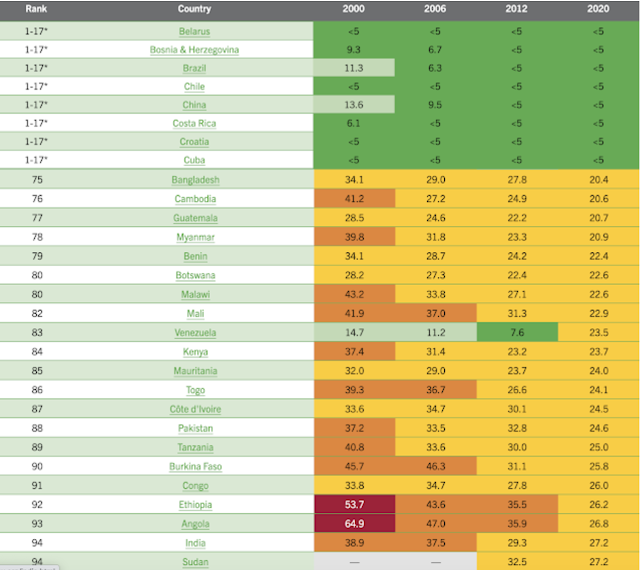 |
| World Hunger Rankings 2020. Source: World Hunger Index Report |
Hunger and malnutrition are worsening in parts of sub-Saharan Africa and South Asia because of the coronavirus pandemic, especially in low-income communities or those already stricken by continued conflict.

India has performed particularly poorly because of one of the world's strictest lockdowns imposed by Prime Minister Modi to contain the spread of the virus.
Hanke Annual Misery Index:

Pakistan's Real GDP:
Vehicles and home appliance ownership data analyzed by Dr. Jawaid Abdul Ghani of Karachi School of Business Leadership suggests that the officially reported GDP significantly understates Pakistan's actual GDP. Indeed, many economists believe that Pakistan’s economy is at least double the size that is officially reported in the government's Economic Surveys. The GDP has not been rebased in more than a decade. It was last rebased in 2005-6 while India’s was rebased in 2011 and Bangladesh’s in 2013. Just rebasing the Pakistani economy will result in at least 50% increase in official GDP. A research paper by economists Ali Kemal and Ahmad Waqar Qasim of PIDE (Pakistan Institute of Development Economics) estimated in 2012 that the Pakistani economy’s size then was around $400 billion. All they did was look at the consumption data to reach their conclusion. They used the data reported in regular PSLM (Pakistan Social and Living Standard Measurements) surveys on actual living standards. They found that a huge chunk of the country's economy is undocumented.
Pakistan's service sector which contributes more than 50% of the country's GDP is mostly cash-based and least documented. There is a lot of currency in circulation. According to the State Bank of Pakistan (SBP), the currency in circulation has increased to Rs. 7.4 trillion by the end of the financial year 2020-21, up from Rs 6.7 trillion in the last financial year, a double-digit growth of 10.4% year-on-year. Currency in circulation (CIC), as percent of M2 money supply and currency-to-deposit ratio, has been increasing over the last few years. The CIC/M2 ratio is now close to 30%. The average CIC/M2 ratio in FY18-21 was measured at 28%, up from 22% in FY10-15. This 1.2 trillion rupee increase could have generated undocumented GDP of Rs 3.1 trillion at the historic velocity of 2.6, according to a report in The Business Recorder. In comparison to Bangladesh (CIC/M2 at 13%), Pakistan’s cash economy is double the size. Even a casual observer can see that the living standards in Pakistan are higher than those in Bangladesh and India.
Related Links:
Haq's Musings
South Asia Investor Review
Pakistan Among World's Largest Food Producers
Food in Pakistan 2nd Cheapest in the World
Indian Economy Grew Just 0.2% Annually in Last Two Years
Pakistan to Become World's 6th Largest Cement Producer by 2030
Pakistan's 2012 GDP Estimated at $401 Billion
Pakistan's Computer Services Exports Jump 26% Amid COVID19 Lockdown
Coronavirus, Lives and Livelihoods in Pakistan
Vast Majority of Pakistanis Support Imran Khan's Handling of Covid1...
Pakistani-American Woman Featured in Netflix Documentary "Pandemic"
Incomes of Poorest Pakistanis Growing Faster Than Their Richest Cou...
Can Pakistan Effectively Respond to Coronavirus Outbreak?
How Grim is Pakistan's Social Sector Progress?
Pakistan Fares Marginally Better Than India On Disease Burdens
Trump Picks Muslim-American to Lead Vaccine Effort
COVID Lockdown Decimates India's Middle Class
Pakistan Child Health Indicators
Pakistan's Balance of Payments Crisis
How Has India Built Large Forex Reserves Despite Perennial Trade De...
Conspiracy Theories About Pakistan Elections"
PTI Triumphs Over Corrupt Dynastic Political Parties
Strikingly Similar Narratives of Donald Trump and Nawaz Sharif
Nawaz Sharif's Report Card
Riaz Haq's Youtube Channel
Views: 2047
-
Comment by Riaz Haq on June 23, 2023 at 8:35pm
-
-
-
Vulnerable employment, total (% of total employment) (modeled ILO estimate) - Pakistan, India | Data
Bangladesh 54%
Pakistan 54%
India 74%
https://data.worldbank.org/indicator/SL.EMP.VULN.ZS?locations=PK-IN-BD
------------
Sandeep Manudhane
@sandeep_PT
Why the size of the economy means little
a simple analysis
1) We are often told that India is now a $3.5 trillion economy. It is growing fast too. Hence, we must be happy with this growth in size as it is the most visible sign of right direction. This is the Quantity is Good argument.
2) We are told that such growth can happen only if policies are right, and all engines of the GDP - consumption, exports, investment, govt. consumption - are doing their job well. We tend to believe it.
3) We are also told that unless GDP grows, how can Indians (on average) grow? Proof is given to us in the form of 'rising per capita incomes' of India. And we celebrate "India racing past the UK" in GDP terms, ignoring that the average Indian today is 20 times poorer than the average Britisher.
4) All this reasoning sounds sensible, logical, credible, and utterly worth reiterating. So we tend to think - good, GDP size on the whole matters the most.
5) Wrong. This is not how it works in real life.
6) It is wrong due to three major reasons
(a) Distribution effect
(b) Concentration of power effect
(c) Inter-generational wealth and income effect
7) First comes the distribution effect. Since 1991, the indisputable fact recorded by economists is that "rich have gotten richer, and poor steadily stagnant or poorer". Thomas Piketty recorded it so well he's almost never spoken in New India now! Thus, we have a super-rich tiny elite of 2-3% at the top, and a vast ocean of stagnant-income 70-80% down below. And this is not changing at all. Do not be fooled by rising nominal per capita figures - factor in inflation and boom! And remember - per capita is an average figure, and it conceals the concentration.
8) Second is the Concentration of power effect. RBI ex-deputy governor Viral Acharya wrote that just 5 big industrial groups - Tata, Birlas, Adanis, Ambanis, Mittals - now disproportionately own the economic assets of India, and directly contribute to inflation dynamics (via their pricing power). This concentration is rising dangerously each year for some time now, and all government policies are designed to push it even higher. Hence, a rising GDP size means they corner more and more and more of the incremental annual output. The per capita rises, but somehow magically people don't experience it in 'steadily improving lives'.
9) Third is the Inter-generational wealth and income effect. Ever wondered why more than 90% of India is working in unstructured, informal jobs, with near-zero social security? Ever wondered why rich families smoothly pass on 100% of their assets across generations while paying zero taxes? Ever wondered how taxes paid by the rich as a per cent of their incomes are not as high as those paid by you and me (normal citizens)? India has no inheritance tax, but has a hugely corporate-friendly tax regime with many policies tailor-made to augment their wealth. Trickle down is impossible in this system. But that was the spiel sold to us in 1991, and later, each year! There is no incentive for giant corporates (and rich folks) to generate more formal jobs, as an ocean of underpaid slaves is ready to slog their entire lives for them. Add to that automation, and now, AI systems!
SUMMARY
Sadly, as India's GDP grows in size, it means little for the masses because trickle-down is near zero. That is because new formal jobs aren't being generated at scale at all (which in itself is a big topic for analysis).
So, our Quantity of GDP is different from Quality of GDP.
https://twitter.com/sandeep_PT/status/1675421203152896001?s=20
-
-
Income of poorest fifth plunged 53% in 5 yrs; those at top surged | India News,The Indian Express
https://indianexpress.com/article/india/income-of-poorest-fifth-plu...
In a trend unprecedented since economic liberalisation, the annual income of the poorest 20% of Indian households, constantly rising since 1995, plunged 53% in the pandemic year 2020-21 from their levels in 2015-16. In the same five-year period, the richest 20% saw their annual household income grow 39% reflecting the sharp contrast Covid’s economic impact has had on the bottom of the pyramid and the top.
---------------
A new survey, which highlights the economic impact of the pandemic on Indian households, found that the income of the poorest 20 percent of the country declined by 53 percent in 2020-21 from that in 2015-16.
https://www.thequint.com/news/india/poor-in-india-lose-half-their-i...
The survey, conducted by the People's Research on India's Consumer Economy (PRICE), a Mumbai-based think tank, also shows that in contrast, the same period saw the annual household income of the richest 20 percent grow by 39 percent.
Conducted between April and October 2021, the survey covered 20,000 households in the first stage, and 42,000 households in the second stage. It spanned over 120 towns and 800 villages in 100 districts.
Income Erosion in All Households Except the Rich Ones
The survey indicated that while the poorest 20 percent households witnessed an income erosion of 53 percent, the lower-middle-class saw a 39-percent decline in household income. The income of the middle-class, meanwhile, reduced by 9 percent.
However, the upper-middle-class and richest households saw their incomes rise by 7 percent and 39 percent, respectively.
The survey also showed that the richest households, on an average, accumulated more income per household as well as pooled income in the past five years than any other five-year period since liberalisation.
While the richest 20 percent accounted for 50.2 percent of the total household income in 1995, the survey shows that their share jumped to 56.3 percent in 2021. In contrast, the share of the poorest 20 percent dropped from 5.9 percent to 3.3 percent in the same period.
While 90 percent of the poorest 20 percent in 2016 lived in rural India, the figure dropped to 70 percent in 2021. In urban areas as well, the share of the poorest 20 percent households went from 10 percent in 2016 to 30 percent in 2021.
"The data reflects that casual labourers, petty traders, household workers, among others, in Tier 1 and Tier 2 cities got hit the most by the pandemic. During the survey, we also noticed that while in rural areas, people in the lower middle income category (Q2) moved to the middle income category (Q3), in the urban areas, the shift has been downwards, from Q3 to Q2. In fact, the rise in poverty level of the urban poor has pulled down the household income of the entire category," reported The Indian Express, quoting Rajesh Shukla, MD and CEO of PRICE.
Most Middle-Class Breadwinners Are Illiterate or Have Primary Schooling
The survey further shows that while a majority of the breadwinners in 'Rich India' (top 20 percent) have completed high-school education (60 percent, of which 40 percent are graduates and above), nearly half of 'Middle India' (60 percent) only have primary education.
As for the bottom 20 percent, 86 percent are either illiterate or just have primary education. Only 6 percent are graduates and above.
(With inputs from The Indian Express, ICE360 2021 Survey.)
(At The Quint, we are answerable only to our audience. Play an active role in shaping our journalism by becoming a member. Because the truth is worth it.)
-
-
In the absence of real data, India's stats are all being manufactured by BJP to win elections.
Postponing India’s census is terrible for the country
But it may suit Narendra Modi just fine
https://www.economist.com/asia/2023/01/05/postponing-indias-census-...
Narendra Modi often overstates his achievements. For example, the Hindu-nationalist prime minister’s claim that all Indian villages have been electrified on his watch glosses over the definition: only public buildings and 10% of households need a connection for the village to count as such. And three years after Mr Modi declared India “open-defecation free”, millions of villagers are still purging al fresco. An absence of up-to-date census information makes it harder to check such inflated claims. It is also a disaster for the vast array of policymaking reliant on solid population and development data.
----------
Three years ago India’s government was scheduled to pose its citizens a long list of basic but important questions. How many people live in your house? What is it made of? Do you have a toilet? A car? An internet connection? The answers would refresh data from the country’s previous census in 2011, which, given India’s rapid development, were wildly out of date. Because of India’s covid-19 lockdown, however, the questions were never asked.
Almost three years later, and though India has officially left the pandemic behind, there has been no attempt to reschedule the decennial census. It may not happen until after parliamentary elections in 2024, or at all. Opposition politicians and development experts smell a rat.
----------
For a while policymakers can tide themselves over with estimates, but eventually these need to be corrected with accurate numbers. “Right now we’re relying on data from the 2011 census, but we know our results will be off by a lot because things have changed so much since then,” says Pronab Sen, a former chairman of the National Statistical Commission who works on the household-consumption survey. And bad data lead to bad policy. A study in 2020 estimated that some 100m people may have missed out on food aid to which they were entitled because the distribution system uses decade-old numbers.
Similarly, it is important to know how many children live in an area before building schools and hiring teachers. The educational misfiring caused by the absence of such knowledge is particularly acute in fast-growing cities such as Delhi or Bangalore, says Narayanan Unni, who is advising the government on the census. “We basically don’t know how many people live in these places now, so proper planning for public services is really hard.”
The home ministry, which is in charge of the census, continues to blame its postponement on the pandemic, most recently in response to a parliamentary question on December 13th. It said the delay would continue “until further orders”, giving no time-frame for a resumption of data-gathering. Many statisticians and social scientists are mystified by this explanation: it is over a year since India resumed holding elections and other big political events.
-
-
One-tenth of India's population escaped poverty in 5 years - government report
By Manoj Kumar
https://www.reuters.com/world/india/one-tenth-indias-population-esc...
NEW DELHI, July 17 (Reuters) - Nearly 135 million people, around 10% of India's population, escaped poverty in the five years to March 2021, a government report found on Monday.
Rural areas saw the strongest fall in poverty, according to the study, which used the United Nations' Multidimensional Poverty Index (MPI), based on 12 indicators such as malnutrition, education and sanitation. If people are deprived in three or more areas, they are identified as "MPI poor."
"Improvements in nutrition, years of schooling, sanitation and cooking fuel played a significant role in bringing down poverty," said Suman Bery, vice-chairman of the NITI Aayog, the government think-tank that released the report.
The percentage of the population living in poverty fell to 15% in 2019-21 from 25% in 2015/16, according to the report, which was based on the 2019-21 National Family Health Survey.
A report by the United Nations Development Programme (UNDP) released last week said the number of people living in multidimensional poverty fell to 16.4% of India's population in 2021 from 55% in 2005.
According to UNDP estimates, the number of people, who lived below the $2.15 per day poverty line had declined to 10% in India in 2021.
India's federal government offers free food grain to about 800 million people, about 57% of country's 1.4 billion population, while states spend billions of dollars on subsidising education, health, electricity and other services.
The state that saw the largest number moving out of poverty was Uttar Pradesh, with 343 million people, followed by the states of Bihar and Madhya Pradesh, according to the report.
Reporting by Manoj Kumar; Editing by Conor Humphries
-
-
Over 10,000 MSMEs shut during 2016-2022 period; 96% in past 3 years, shows govt data | The Financial Express
https://www.financialexpress.com/industry/sme/msme-eodb-over-10000-...
Ease of Doing Business for MSMEs: The government has come out with consolidated data on the number of MSMEs closed over the past six years including the Covid period in the country. According to the combined data from the Udyam registration portal and the erstwhile Udyog Aadhaar Memorandum (UAM), 10,067 MSMEs were shut from 2016 to 2022.
Sharing data in the Rajya Sabha on Monday in a written reply to a question on the closure of units, Minister of State for MSMEs Bhanu Pratap Singh Verma noted that 400 MSMEs (4 per cent of total closures) were shut during the 2016-2019 period as per the UAM data. On the other hand, the majority 96 per cent units — 9,667 were shut between 2019 and 2022, according to the UAM and Udyam portal data.
In reply to a separate question on the Covid impact on MSMEs, Verma shared that 2,870 MSMEs registered on the Udyam portal were shut between April 1, 2022, and July 20, 2022, along with employment loss for 19,862 people. Likewise, 6,222 Udyam-registered MSMEs were shut in FY22 with 42,662 people losing jobs. Between July 1, 2020, and March 31, 2021, 175 Udyam units were closed and 724 jobs were lost.
“Closure of MSMEs is certainly a concern for the government for which necessary steps and studies have been undertaken. The closure is one of the reasons cited by units for cancelling their MSME registrations, but the reason for closure is not always mentioned by them. Other reasons for cancelling registrations include stopping the manufacturing of goods or moving to other businesses or they just don’t need the registration anymore,” Ishita Ganguli Tripathy, Additional Development Commissioner, Ministry of MSME told Financial Express Online.
Citing studies by SIDBI, SBI, and others, Tripathy noted that while there have been closures, some of them have been temporary and due to schemes such as Emergency Credit Line Guarantee Scheme (ECLGS), many MSMEs have been able to save employment as well.
-
-
Only a cheaper rupee can spur Indian growth
https://www.ft.com/content/c3a28628-5b92-4db7-a8c2-0f41bea05969
Elite interest favours a strong currency, to the detriment of the nation
ASHOKA MODY
While other Asian policymakers, such as those in South Korea and China, have strategically used sizeable depreciations of their currencies to bolster export competitiveness, Indian elites bemoan every infinitesimal decline in the rupee’s value as a national humiliation. A unique economic and political confluence first entrenched this bogus pride in the country’s psyche in the mid-1960s. And since the 1990s, the country’s corporate leaders and new rich have wanted to maintain a strong rupee. As a result, the country’s export-based growth has suffered, as have jobs for low-skilled workers.
India is triply handicapped in exporting manufactured goods: it has a poorly educated workforce, few women in its factories and an overvalued currency. Education and female labour force participation are key to raising productivity, but take years to achieve. Today, only a much cheaper currency — about 100 rupees per dollar rather than the current 82 — can spur Indian exports. It is low-hanging fruit.
In a rare sane moment in 1949, a newly independent India devalued the rupee from Rs3.3 to Rs4.8 per dollar, bringing relief to its uncompetitive economy. Indian manufacturers could earn profits even when they lowered dollar sale prices, which helped increase exports. Costlier imports slowed import growth, helping reduce the current-account deficit. But the task was never completed. With low productivity and high inflation, India could not match countries such as Japan in labour-intensive manufactured exports. The World Bank and the IMF financed India’s large current account deficit, creating the illusion that it did not need currency devaluation.
When those two institutions finally threatened to stop financing that deficit, the country’s officials foolishly negotiated the rate to Rs7.5 per dollar in June 1966. This too-little-too-late devaluation did not compensate for the rise in domestic production costs. Taiwan and South Korea raced ahead, helped by currency devaluations; Indian exports languished.
The perceived failure of the 1966 devaluation to spur exports forever tarnished Indian belief in an activist exchange rate policy. Rather than encouraging more aggressive nominal devaluation to offset the rise in production costs and thus achieve real depreciation, devaluation “by stealth” was always too little, too late. In the 1980s, China used aggressive exchange rate depreciation as key to its monumental export push.
India’s 1991 financial crisis was another all too brief moment of sanity. Authorities devalued the rupee in July 1991 and let it float in March 1993. But new forces strengthened the currency. Software exports and remittances from workers in the Middle East had a bolstering effect. More importantly, once global money managers began funding large Indian companies, a strong rupee helped that small elite minimise the costs of repaying international creditors and investors. A strong rupee also helped aspirants to elite status shop for fast cars and handbags, often in Milan and Singapore.
Reflecting the national sense of pride and elite preference, political gamesmanship conditioned policymakers to focus on stemming the currency’s decline. In 2013, prime ministerial candidate Narendra Modi bemoaned the fall in the currency, saying: “Our rupee has been admitted into the ICU.” After Modi became prime minister, hot money flowed in and the rupee appreciated briefly. But when it fell again, leaders of the opposition trolled the government by repeating Modi’s phrase: the rupee was in the ICU.
-
-
Only a cheaper rupee can spur Indian growth
https://www.ft.com/content/c3a28628-5b92-4db7-a8c2-0f41bea05969
Elite interest favours a strong currency, to the detriment of the nation
ASHOKA MODY
Sadly, the nominal depreciation was not enough. According to the Bank for International Settlements, between 1994 and now, India’s domestic costs of export production have risen by about 60 per cent relative to competitors. As a result, the real exchange rate, which determines international competitiveness, has strengthened by 12 per cent. Vietnamese manufactured exports, following the East Asian playbook, are poised to exceed India’s manufactured exports.
India’s accumulated cost-of-production disadvantage requires the rupee to drop to about Rs90 per dollar; Rs100 per dollar would provide an ideal cushion. But Indian authorities continue to avoid an activist exchange rate policy, and rely on dodgy policy tools: tax cuts and subsidies for corporate India, tariff barriers to shield inefficient producers and weaker labour protections. Such measures simply make the rich richer, while doing little for low-skilled workers. An exchange value of Rs100 per dollar would temporarily give Indian exports a much-needed boost. The time to act is now.
-
-
Ritesh Kumar Singh
@RiteshEconomist
India's premature #deindustrialisation: 12 out of the 23 #manufacturing industries that make up the IIP (Index of Industrial Production) are at levels lower than 7 years ago
@moneycontrolcom
https://twitter.com/RiteshEconomist/status/1691499535170674698?s=20
-----------------
India's industrial growth falls to 3.7% in June
https://www.moneycontrol.com/europe/?url=https://www.moneycontrol.c....
India's industrial output grew by 3.7 percent in June, according to data released by the Ministry of Statistics and Programme Implementation on August 11.
At 3.7 percent, the latest industrial growth figure as per the Index of Industrial Production (IIP) is at a three-month low. It is also below the consensus estimate of 5 percent.
Industrial growth had come in at 5.2 percent in May - now revised to 5.3 percent - and was 12.6 percent in June 2022.
For the first quarter of 2023-24, IIP growth stood at 4.5 percent, down from 12.9 percent in April-June 2022 when the data was boosted by a favourable base effect.
Industrial growth in June was dragged down by a weaker increase in the manufacturing output, which rose by 3.1 percent year-on-year compared to 5.8 percent in May.
The performance of the manufacturing sector has an outsized impact on the headline industrial growth number as the sector accounts for more than three-fourths of the IIP.
While manufacturing output grew at a slower pace, that of mining and electricity rose at a faster clip. In June, mining output rose by 7.6 percent, up from 6.4 percent in May, and electricity production was up 4.2 percent. In May, electricity production was up a mere 0.9 percent.
The improved performance of mining and electricity sectors was down the low rainfall in June as drier conditions allow increased mining activity.
"IIP growth print in June has disappointed," said Suman Chowdhury, chief economist and head of research at Acuité Ratings & Research.
"Clearly, the manufacturing sector has not been able to sustain the growth trend that had been seen in the first two months of the last quarter. The manufacturing output grew only by 3.1 percent and actually saw a sequential contraction of almost 1 percent," Chowdhury added.
"Within manufacturing, output in metals exhibited a healthy performance while export-intensive categories such as textiles and wearing apparel continued to remain pressured," noted Rajani Sinha, chief economist at CareEdge.
In terms of the use-based classification of goods, there were some big shocks. While production of primary and intermediate good rose at a greater rate in June - 5.2 percent and 4.5 percent, respectively - there were weaknesses in other spheres, with output of consumer durables falling 6.9 percent in June after rising for the for the first time in six months in May.
Capital goods' output was up just 2.2 percent - down from 8.1 percent in May - while that of consumer non-durables rose a mere 1.2 percent. in May, it had posted a growth of 8.4 percent.
Output of infrastructure goods grew by 11.3 percent - the same as in May.
According to Aditi Nayar, ICRA's chief economist, the performance of most high-frequency indicators improved in July relative to June, although there were some laggards in the form of vehicle registrations and finished steel consumption.
"Based on these trends, ICRA expects the IIP growth to witness an uptick to 4-6 percent in July," Nayar said.
-
-
To Understand India’s Economy, Look Beyond the Spectacular Growth Numbers - The Wall Street Journal.
https://www.wsj.com/world/india/to-understand-indias-economy-look-b...
But the way India calculates its gross domestic product can at times overstate the strength of growth, in part by underestimating the weakness in its massive informal economy. There are also other indicators, such as private consumption and investment, that are pointing to soft spots. Despite cuts to corporate taxes, companies don’t appear to be spending on expansions.
-------------
BENGALURU, India—India is set to be the world’s fastest-growing major economy this year, but economists say the country’s headline growth numbers don’t tell the whole story.
The South Asian nation’s gross domestic product grew at more than 8% in its fiscal year ended in March compared with the previous year, driven by public spending on infrastructure, services growth, and an uptick in manufacturing. That would put India well ahead of China, which is growing at about 5%, and on track to hit Prime Minister Narendra Modi’s goal of becoming a developed nation by 2047.
But the way India calculates its gross domestic product can at times overstate the strength of growth, in part by underestimating the weakness in its massive informal economy. There are also other indicators, such as private consumption and investment, that are pointing to soft spots. Despite cuts to corporate taxes, companies don’t appear to be spending on expansions.
“If people were optimistic about the economy, they would invest more and consume more, neither of which is really happening,” said Arvind Subramanian, a senior fellow at the Peterson Institute for International Economics and former chief economic adviser to the Modi government.
Private consumption, the biggest contributor to GDP, grew at 4% for the year, still slower than pre-pandemic levels. What’s more, economists say, it could have been even weaker if the government hadn’t continued its extensive food-subsidy program that began during the pandemic.
The problem is driven in part by how India emerged from the pandemic. Big businesses and people who are employed in India’s formal economy are generally doing well, but most Indians are in the informal sector or agriculture, and many of them lost work.
While India’s official data last year put unemployment at around 3%, economists also closely track data from the Centre for Monitoring Indian Economy, a private economic research firm. It put unemployment at 8% for the year ended March.
At a small tea-and-cigarette stall in the southern city of Bengaluru, 55-year-old Ratnamma said many of her customers in the neighborhood, which once bustled with tech professionals and blue-collar workers, have moved out of the city and returned to rural villages. Some have come back, but she has fewer customers than she once did.
“Where did everyone go?” she said.
She makes about $12 a day in sales, she said, compared with as much as $100 on a good day in the past. It isn’t enough to cover her living expenses or repay a business loan she took out six months ago.
Economists say that the informal sector has been through three shocks in a decade—a 2016 policy aimed at tax evasion called “demonetization” that wiped out 90% of the value of India’s paper currency, a tax overhaul the following year that created more paperwork and expenses for small businesses, and the pandemic.
Comment
You need to be a member of PakAlumni Worldwide: The Global Social Network to add comments!
Twitter Feed
Live Traffic Feed
Sponsored Links
South Asia Investor Review
Investor Information Blog
Haq's Musings
Riaz Haq's Current Affairs Blog
Please Bookmark This Page!
Blog Posts
Trump Administration Seeks Pakistan's Help For Promoting “Durable Peace Between Israel and Iran”
US Secretary of State Marco Rubio called Pakistan Prime Minister Shehbaz Sharif to discuss promoting “a durable peace between Israel and Iran,” the State Department said in a statement, according to Reuters. Both leaders "agreed to continue working together to strengthen Pakistan-US relations, particularly to increase trade", said a statement released by the Pakistan government.…
ContinuePosted by Riaz Haq on June 27, 2025 at 8:30pm — 3 Comments
Clean Energy Revolution: Soaring Solar Energy Battery Storage in Pakistan
Pakistan imported an estimated 1.25 gigawatt-hours (GWh) of lithium-ion battery packs in 2024 and another 400 megawatt-hours (MWh) in the first two months of 2025, according to a research report by the Institute of Energy Economics and Financial Analysis (IEEFA). The report projects these imports to reach 8.75 gigawatt-hours (GWh) by 2030. Using …
ContinuePosted by Riaz Haq on June 14, 2025 at 10:30am — 3 Comments
© 2025 Created by Riaz Haq.
Powered by
![]()
https://foreignpolicy.com/2023/06/23/modi-india-economy-success-story/
Modi’s deft use of direct benefit programs—such as the installation of toilets in homes, electricity hookups, and distribution of cooking gas—has certainly improved his citizen’s lives. While these programs do little to redistribute wealth or change India’s economic trajectory, the tangibility of these home-based benefits has redounded to Modi’s personal popularity and helps to explain his slight electoral edge with women.
But these programs, together with Modi’s Hindu nationalist stunts—such as the construction of a massive Hindu temple on the remains of an ancient mosque, which was destroyed by Hindu nationalist mobs in 1992—also help to distract his supporters from his government’s myriad failures. This combination of institutionalized anti-minority violence, authoritarian crackdowns on free press and critics, youth unemployment, and soaring inequality, is explosive in Modi’s India.
Modi’s Gujarat model of using capital-intensive infrastructure as a primary engine for growth has derailed—even for Gujarat. India is now stuck in a jobless growth trap that prioritizes capital but generates low labor participation and low human capital. As the economist R. Nagaraj concludes, “Never in the past seven decades has India witnessed such an economic reversal, and the gravity of the problem is perhaps yet to sink into the minds of policymakers and the public.”