PakAlumni Worldwide: The Global Social Network
The Global Social Network
Misery Index: Who's Less Miserable? India or Pakistan?
Pakistanis are less miserable than Indians in the economic sphere, according to the Hanke Annual Misery Index (HAMI) published in early 2021 by Professor Steve Hanke. With India ranked 49th worst and Pakistan ranked 39th worst, both countries find themselves among the most miserable third of the 156 nations ranked. Hanke teaches Applied Economics at Johns Hopkins University in Baltimore, Maryland. Hanke explains it as follows: "In the economic sphere, misery tends to flow from high inflation, steep borrowing costs, and unemployment. The surefire way to mitigate that misery is through economic growth. All else being equal, happiness tends to blossom when growth is strong, inflation and interest rates are low, and jobs are plentiful". Several key global indices, including misery index, happiness index, hunger index, food affordability index, labor force participation rate, ILO’s minimum wage data, all show that people in Pakistan are better off than their counterparts in India.
Hanke's Misery Index:
Hanke's Annual Misery Index (HAMI) ranks Pakistan 49th (32.5) and India 39th (35.8) most miserable for year 2020. Bangladesh is significantly better than both India and Pakistan with a misery index of 14 and rank of 129. Venezuela ranks number 1 as the world's most miserable country followed by Zimbabwe 2nd, Sudan 3rd, Lebanon 4th and Suriname 5th among 156 countries ranked this year. The rankings for the two South Asian nations are supported by other indices such as the World Bank Labor Participation data, International Labor Organization Global Wage Report, World Happiness Report, Food Affordability Index and Global Hunger Index.
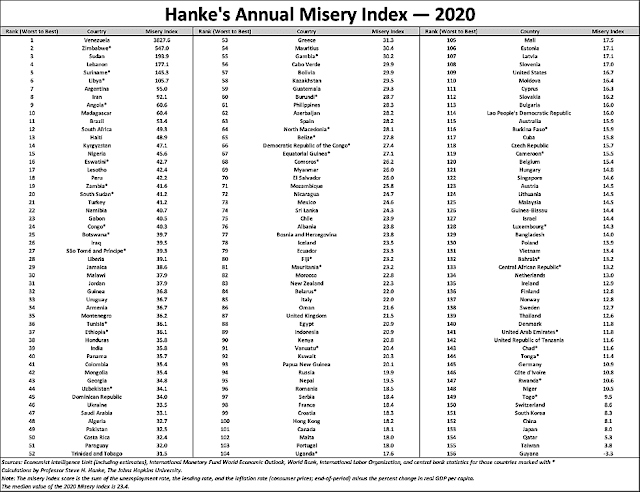 |
| Hanke's Annual Misery Index 2021. Source: National Review |
Employment and Wages:
Labor force participation rate in Pakistan is slightly above 50% during this period, indicating about 2% drop in 2020. Even before COVID pandemic, there was a steep decline in labor force participation rate in India. It fell from 52% in 2014 to 47% in 2020.
 |
| Labor Force Participation Rates in Pakistan (Top), India (bottom). ... |
The International Labor Organization (ILO) Global Wage Report 2021 indicates that the minimum wage in Pakistan is the highest in South Asia region. Pakistan's minimum monthly wage of US$491 in terms of purchasing power parity while the minimum wage in India is $215. The minimum wage in Pakistan is the highest in developing nations in Asia Pacific, including Bangladesh, India, China and Vietnam, according to the International Labor Organization.
 |
| Monthly Minimum Wages Comparison. Source: ILO |
The impact on livelihoods of workers in developing nations during the COVID pandemic has varied depending on the size of the informal work forces, according to The Economist magazine.
 |
| Workers in Informal Economy of Selected Developing Countries. Sourc... |
Most countries with large informal work forces have recovered but India's jobs crisis has only deepened since the start of the COVID19 pandemic. Latest CMIE data indicates that employment rate in India was just 37.34% in November, 2021.
 |
| Asian Employment Rates. |
 |
| History of Inflation in Pakistan. Source: Statista |
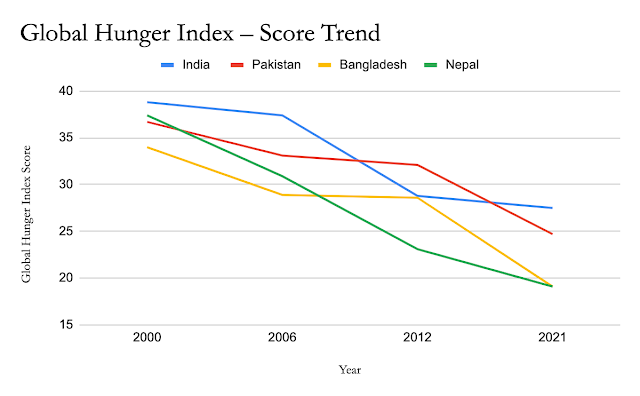 |
| Hunger Trends in South Asia. Source: Global Hunger Index |
Amid the COVID19 pandemic, Pakistan's World Happiness ranking has dropped from 66 (score 5.693) among 153 nations last year to 105 (score 4.934) among 149 nations ranked this year. Neighboring India is ranked 139 and Afghanistan is last at 149. Nepal is ranked 87, Bangladesh 101, Pakistan 105, Myanmar126 and Sri Lanka129. Finland retained the top spot for happiness and the United States ranks 19th.
 |
| Pakistan Happiness Index Trend 2013-2021 |
One of the key reasons for decline of happiness in Pakistan is that the country was forced to significantly devalue its currency as part of the IMF bailout it needed to deal with a severe balance-of-payments crisis. The rupee devaluation sparked inflation, particularly food and energy inflation. Global food prices also soared by double digits amid the coronavirus pandemic, according to Bloomberg News. Bloomberg Agriculture Subindex, a measure of key farm goods futures contracts, is up almost 20% since June. It may in part be driven by speculators in the commodities markets. These rapid price rises have hit the people in Pakistan and the rest of the world hard. In spite of these hikes, Pakistan remains among the least expensive places for food, according to recent studies. It is important for Pakistan's federal and provincial governments to rise up to the challenge and relieve the pain inflicted on the average Pakistani consumer.
Pakistan's Real GDP:
Many economists believe that Pakistan’s economy is at least double the size that is officially reported in government's Economic Surveys. The GDP has not been rebased in more than a decade. It was last rebased in 2005-6 while India’s was rebased in 2011 and Bangladesh’s in 2013. Just rebasing the Pakistani economy will result in at least 50% increase in official GDP. A research paper by economists Ali Kemal and Ahmad Wasim of PIDE (Pakistan Institute of Development Economics) estimated in 2012 that the Pakistani economy’s size then was around $400 billion. All they did was look at the consumption data to reach their conclusion. They used the data reported in regular PSLM (Pakistan Social and Living Standard Measurements) surveys on actual living standards. They found that a huge chunk of the country's economy is undocumented.
Pakistan's service sector which contributes more than 50% of the country's GDP is mostly cash-based and least documented. There is a lot of currency in circulation. According to the State Bank of Pakistan (SBP), the currency in circulation has increased to Rs. 7.4 trillion by the end of the financial year 2020-21, up from Rs 6.7 trillion in the last financial year, a double-digit growth of 10.4% year-on-year. Currency in circulation (CIC), as percent of M2 money supply and currency-to-deposit ratio, has been increasing over the last few years. The CIC/M2 ratio is now close to 30%. The average CIC/M2 ratio in FY18-21 was measured at 28%, up from 22% in FY10-15. This 1.2 trillion rupee increase could have generated undocumented GDP of Rs 3.1 trillion at the historic velocity of 2.6, according to a report in The Business Recorder. In comparison to Bangladesh (CIC/M2 at 13%), Pakistan’s cash economy is double the size. Even a casual observer can see that the living standards in Pakistan are higher than those in Bangladesh and India.
Related Links:
Haq's Musings
South Asia Investor Review
Pakistan Among World's Largest Food Producers
Food in Pakistan 2nd Cheapest in the World
Pakistan's Pharma Industry Among World's Fastest Growing
Pakistan to Become World's 6th Largest Cement Producer by 2030
Pakistan's 2012 GDP Estimated at $401 Billion
Pakistan's Computer Services Exports Jump 26% Amid COVID19 Lockdown
Coronavirus, Lives and Livelihoods in Pakistan
Vast Majority of Pakistanis Support Imran Khan's Handling of Covid1...
Pakistani-American Woman Featured in Netflix Documentary "Pandemic"
Incomes of Poorest Pakistanis Growing Faster Than Their Richest Cou...
Can Pakistan Effectively Respond to Coronavirus Outbreak?
How Grim is Pakistan's Social Sector Progress?
Pakistan Fares Marginally Better Than India On Disease Burdens
Trump Picks Muslim-American to Lead Vaccine Effort
Democracy vs Dictatorship in Pakistan
Pakistan Child Health Indicators
Pakistan's Balance of Payments Crisis
Panama Leaks in Pakistan
Conspiracy Theories About Pakistan Elections"
PTI Triumphs Over Corrupt Dynastic Political Parties
Strikingly Similar Narratives of Donald Trump and Nawaz Sharif
Nawaz Sharif's Report Card
Riaz Haq's Youtube Channel
Views: 847
-
Comment by Riaz Haq on December 24, 2021 at 8:44pm
-
India’s Stalled Rise
How the State Has Stifled Growth
By Arvind Subramanian and Josh Felman
January/February 2022
https://www.foreignaffairs.com/articles/india/2021-12-14/indias-sta...
For the Indian economy to achieve its potential, however, the government will need a sweeping new approach to policy—a reboot of the country’s software. Its industrial policy must be reoriented toward lower trade barriers and greater integration into global supply chains. The national champions strategy should be abandoned in favor of an approach that treats all firms equally. Above all, the policymaking process itself needs to be improved, so that the government can establish and maintain a stable economic environment in which manufacturing and exports can flourish.
But there is little indication that any of this will occur. More likely, as India continues to make steady improvements in its hardware—its physical and digital infrastructure, its New Welfarism—it will be held back by the defects in its software. And the software is likely to prove decisive. Unless the government can fundamentally improve its economic management and instill confidence in its policymaking process, domestic entrepreneurs and foreign firms will be reluctant to make the bold investments necessary to alter the country’s economic course.
There are further risks. The government’s growing recourse to majoritarian and illiberal policies could affect social stability and peace, as well as the integrity of institutions such as the judiciary, the media, and regulatory agencies. By undermining democratic norms and practices, such tendencies could have economic costs, too, eroding the trust of citizens and investors in the government and creating new tensions between the federal administration and the states. And India’s security challenges on both its eastern and its western border have been dramatically heightened by China’s expansionist activity in the Himalayas and the takeover of Afghanistan by the Pakistani-supported Taliban.
If these dynamics come to dominate, the Indian economy could experience another disappointing decade. Of course, there would still be modest growth, with some sectors and some segments of the population doing particularly well. But a broader boom that transforms and improves the lives of millions of Indians and convinces the world that India is back would be out of reach. In that case, the current government’s aspirations to global economic leadership may prove as elusive as those of its predecessors.
-
-
#Modi’s #India: #Income of the poorest 20% #Indians plunged 53% in 5 yrs while the richest 20% saw their annual household income grow 39%. #Inequality #BJP #Hindutva #Covid | India News,The Indian Express
https://indianexpress.com/article/india/income-of-poorest-fifth-plu...
In a trend unprecedented since economic liberalisation, the annual income of the poorest 20% of Indian households, constantly rising since 1995, plunged 53% in the pandemic year 2020-21 from their levels in 2015-16. In the same five-year period, the richest 20% saw their annual household income grow 39% reflecting the sharp contrast Covid’s economic impact has had on the bottom of the pyramid and the top.
This stark K-shaped recovery emerges in the latest round of ICE360 Survey 2021, conducted by People’s Research on India’s Consumer Economy (PRICE), a Mumbai- based think-tank.
The survey, between April and October 2021, covered 200,000 households in the first round and 42,000 households in the second round. It was spread over 120 towns and 800 villages across 100 districts.
While the pandemic brought economic activity to a standstill for at least two quarters in 2020-21 and resulted in a 7.3% contraction in GDP in 2020-21, the survey shows that the pandemic hit the urban poor most and eroded their household income.
Splitting the population across five categories based on income, the survey shows that while the poorest 20% (first quintile) witnessed the biggest erosion of 53%, the second lowest quintile (lower middle category), too, witnessed a decline in their household income of 32% in the same period. While the quantum of erosion reduced to 9% for those in the middle income category, the top two quintiles — upper middle (20%) and richest (20%)— saw their household income rise by 7% and 39% respectively.
The survey shows that the richest 20% of households have, on average, added more income per household and more pooled income as a group in the past five years than in any five-year period earlier since liberalisation. Exactly the opposite has happened for the poorest 20% of households — on average, they have never actually seen a decrease in household income since 1995. Yet, in 2021, in a huge knockout punch caused by Covid, they earned half as much as they did in 2016.
How disruptive this distress has been for those at the bottom of the pyramid is reinforced by the fact that in the previous 11-year period between 2005 and 2016, while the household income of the richest 20% grew by 34%, the poorest 20% saw their household income surge by 183% at an average annual growth rate of 9.9%.
Coming in the run-up to the Budget, the task for the Government is cut out.
“As the Finance Minister is finalising her budget proposals for 2022-23 to give shape to the roadmap for economic revival of the country,” said Rajesh Shukla, MD and CEO, PRICE, “we need a K-shaped policy too that addresses the two ends of the spectrum and a lot more thinking on how to build the bridge between the two.”
This couldn’t be more timely. Said PRICE founder and one of the authors of the survey Rama Bijapurkar. “Or else, we are back to a tale of two Indias, a narrative we thought we were rapidly getting rid of. The good news is that we have built a far more efficient welfare state for the disbursal of benefit be it DBT or vaccination for all.”
The survey showed that while the richest 20% accounted for 50.2% of the total household income in 1995, their share has jumped to 56.3% in 2021. On the other hand, the share of the poorest 20% dropped from 5.9% to 3.3% in the same period.
As for India Inc, it has been in a better position to weather the disruption. The pandemic accelerated further formalisation of the economy with large companies benefitting at the cost of smaller ones. The survey also shows that while job losses were quite evident among Small and Medium Enterprises in the casual labour segment, large companies did not witness much of that.
-
-
#Modi’s #India: #Income of the poorest 20% #Indians plunged 53% in 5 yrs while the richest 20% saw their annual household income grow 39%. #Inequality #BJP #Hindutva #Covid | India News,The Indian Express
https://indianexpress.com/article/india/income-of-poorest-fifth-plu...
Even among the poorest 20 per cent, those in urban areas got more impacted than their rural counterparts as the first wave of Covid and the lockdown led to stringent curbs on economic activity in urban areas. This resulted in job losses and loss of income for the casual labour, petty traders household workers.
Data shows that there has been a rise in the share of poor in cities. While 90 per cent of the poorest 20 per cent in 2016, lived in rural India, that number had dropped to 70 per cent in 2021. On the other hand the share of poorest 20 per cent in urban areas has gone up from around 10 per cent to 30 per cent now.
“The data reflects that the casual labour, petty trader, household workers among others in Tier 1 and Tier 2 cities got hit most by the pandemic. During the survey we also noticed that while in rural areas people in lower middle income category (Q2) have moved to middle income category (Q3), in the urban areas the shift has been downwards from Q3 to Q2. In fact, the rise in poverty level of urban poor has pulled down the household income of the entire category down,” said Shukla.
“The elephant in the room is investment,” said Bijapurkar. “Inspiring confidence through long-term policy stability and improving ease of doing business should make the tide rise again and sweep small business and individuals up along with it. Most big companies are doing well and don’t need more help but we need to work the economy for the bottom half.”
-
-
How long does it take to earn the money to buy an Apple iPhone 12?
Based on minimum wage levels, a new report from Grover.com estimates it would take 6,639 hours for a Venezuelan to earn enough for the prized smartphone and 3,254 hours for an Indian. Chinese people must work 680 hours to make enough money.
1642 Hours in Pakistan
1791 Hours in Indonesia
3254 Hours in India
2045 Hours in Egypt
Need-to-Know Research
https://www.bloomberg.com/news/newsletters/2022-02-04/what-s-happen...
https://twitter.com/economics/status/1490386589578575876?s=20&t...
Minimum Monthly Wage levels in selected countries:
Pakistan: $491
Nepal: $396
Vietnam: $388
China: $353
Afghanistan: $306
Sri Lanka: $247
India: $215
Solomon Islands: $213
Bangladesh: $48
https://www.tbsnews.net/economy/bangladeshs-monthly-minimum-wage-lo...
-
-
#India #currency in circulation up 9.9% to over ₹31 lakh crore in FY22. Share of ₹500 and ₹2,000 notes together rose to 87.1% of total value of banknotes in circulation, despite #Modi's #DigitalIndia and #fintech. #Demonetization #BJP https://www.fortuneindia.com/macro/currency-in-circulation-up-99-to...
The value and volume of banknotes in circulation increased by 9.9% and 5%, respectively, at ₹31,05,721 crore and 13.05 lakh, respectively, the Reserve Bank of India's annual report for 2021-22 shows. Comparatively, the increase in currency in circulation (both value and volume terms) was 16.8% and 7.2%, respectively, during 2020-21.
The rise in banknotes in circulation, despite the government's push for digital India and various reforms in the banking and fintech industry, has been attributed to "the second wave of COVID-19 pandemic, which induced renewed restrictions on movement in various parts of the country”.
The RBI supplies banknotes in denominations of ₹2, ₹5, ₹10, ₹20, ₹50, ₹100, ₹200, ₹500 and ₹2,000, while coins comprise 50 paise and ₹1, ₹2, ₹5, ₹10 and ₹20 denominations.The share of ₹500 banknotes, both in value and volume, increased during 2021-22 as compared to the previous year. However, the ₹2,000 banknote share continued to dip in both value and volume.In value terms, the share of these banknotes together accounted for 87.1% of the total value of banknotes in circulation as of March 31, 2022, against 85.7% on March 31, 2021.In volume terms, ₹500 notes constituted the highest share at 34.9%, followed by ₹10 denomination at 21.3% of the total currency in circulation as of March 31, 2022.The total value of coins in circulation rose 4.1% to ₹27,970 crore in 2021-22, while its volume grew 1.3% to 12,46,298.As of March 31, 2022, the coins of ₹1, ₹2 and ₹5 together constituted 83.5% of the total volume of coins in circulation, while in value terms, these denominations accounted for 75.8%.The currency issuance (both banknotes and coins) and its management are performed by the RBI through its issue offices, currency chests and small coin depots spread across the country.As of March 31, 2022, the State Bank of India accounted for the highest share of 53.6% in the currency chests network. The indent of banknotes was lower by 1.8% in 2021-22 than that of a year ago. The supply of banknotes was also marginally lower by 0.4% during the said year than the previous year.During 2021-22, the indent and supply of coins saw a huge drop at 73.3% and 73%, respectively, from the previous year.The RBI data shows that the year 2021-22 saw an 88.4% rise in the disposal of soiled banknotes as compared to the previous year at 1,878.01 crore pieces vs 997.02 crore pieces during the previous year.During the fiscal year 2021-22, of the total fake currency notes detected in the banking sector, 6.9% were detected at the RBI and 93.1% by other banks.Compared to the previous year, there was an increase of 16.4 per cent, 16.5 per cent, 11.7 per cent, 101.9 per cent and 54.6 per cent in the counterfeit notes detected in the denominations of ₹10, ₹20, ₹200, ₹500 (new design) and ₹2,000, respectively.Overall, the RBI spent ₹4,984.8 crore on security printing from April 1, 2021, to March 31, 2022, against ₹4,012.1 crore in the previous year (July 1, 2020, to March 31, 2021).
-
-
India’s retail inflation basket needs to be revised to improve the efficacy of monetary policy, according to a paper by a New Delhi-based economic policy think-tank.
https://www.bnnbloomberg.ca/india-inflation-basket-needs-urgent-rev...
“Higher the weightage of food in overall CPI, the more cumbersome it is for monetary policy to contain inflation,” economists including Deepak Mishra and Ashok Gulati wrote. “The structure of headline inflation in India is quite different from the advanced economies which limits the efficacy of monetary policy in India,” they wrote.
Food and beverages constitute nearly 46% of India’s CPI basket. This is in contrast to many advanced economies where food weights are much lower, such as UK’s 9.3%, US’ 13.2% and Canada’s 15.94%.
The Reserve Bank of India uses retail inflation as a benchmark to set borrowing costs and targets inflation between 2%-6%. Prices have stayed above its mandated range since the beginning of the year, raising a clamor to update the consumer price inflation basket that has not been revised for over a decade.
“This corroborates the urgency to revise CPI with the latest consumption survey weights,” the researchers said. Policy measures need to focus on various supply-side bottlenecks, especially in food items which could be managed by increasing productivity by investing in research and development in agriculture, they said.
Comment
- ‹ Previous
- 1
- 2
- 3
- Next ›
Twitter Feed
Live Traffic Feed
Sponsored Links
South Asia Investor Review
Investor Information Blog
Haq's Musings
Riaz Haq's Current Affairs Blog
Please Bookmark This Page!
Blog Posts
AI Battle: A Chinese AI Model Fights Off OpenAI's Rogue Agent
Rogue AI agents are no longer just the stuff of science fiction. When an OpenAI rogue agent launched a cyber attack against AI startup Hugging Face this month, the company fought fire with fire, using an open-source Chinese AI model to defend against it.

During a test in a sandbox, an OpenAI autonomous agent managed to sneak out and attack a website operated by HuggingFace, an AI startup based in New York City.…
Posted by Riaz Haq on July 26, 2026 at 9:33pm — 3 Comments
Pakistan Joins China in World AI Cooperation Organization (WAICO)
On July 16 in Shanghai, 29 countries, including China, Pakistan and Russia, signed the founding agreement of WAICO, World AI Cooperation Organization. Every BRICS founding member is in, except India. This agreement follows the launch of the US-led Pax Silica, a 24-member coalition, including India, which is designed to counter China's AI efforts. The stated goal of both these competing groups is to provide global governance, including building guardrails and setting…
ContinuePosted by Riaz Haq on July 20, 2026 at 6:26pm — 14 Comments
© 2026 Created by Riaz Haq.
Powered by
![]()
You need to be a member of PakAlumni Worldwide: The Global Social Network to add comments!
Join PakAlumni Worldwide: The Global Social Network