Credit Suisse Wealth Report: Average Pakistani 20% Richer Than Average Indian

Average Pakistani adult is 20% richer than an average Indian adult and the median wealth of a Pakistani adult is 120% higher than that of his or her Indian counterpart, according to Credit Suisse Wealth Report 2016. Average household wealth in Pakistan has grown 2.1% while it has declined 0.8% in India since the end of last year.

Source: Credit Suisse Wealth Report 2016

Here are the key statistics reported by Credit Suisse:

Total Household Wealth Mid-2016 :

India $3,099 billion Pakistan $524 billion

Wealth per adult:

India Year End 2000 Average $2,036 Median $498.00

Pakistan Year End 2000 Average $2,399 Median $1,025

India Mid-2016 Average $3,835 Median $608

Pakistan Mid-2016 Average $4,595 Median $1,788

Average wealth per adult in Pakistan is $760 more than in India or about 20% higher.

Median wealth per adult in Pakistan is $1,180 more than in India or about 120% higher

Inequality: 

Median wealth data indicates that 50% of Pakistanis own more than $1,180 per adult which is 120% more than the $608 per adult owned by 50% of Indians.

The Credit-Suisse report says that the richest 1% of Indians own 58.4% of India's wealth, second only to Russia's at 74.5%. That makes India the 2nd biggest oligarchy in the world.

The CS wealth data, particularly the median wealth figures,  clearly show that Pakistan has much lower levels of inequality than India.

Source: Bloomberg

World Bank Report:

A November 2016 World Bank report says that Pakistan has successfully translated economic growth into the well-being of its poorest citizens. It says "Pakistan’s recent growth has been accompanied by a staggering fall in poverty".

Rising incomes of the poorest 20% in Pakistan since 2002 have enabled them to enhance their living standards by improving their diets and acquiring television sets, refrigerators, motorcycles, flush toilets, and better housing.

Another recent report titled "From Wealth to Well Being" by Boston Consulting Group (BCG) also found that Pakistan does better than India and China in translating GDP growth to citizens' well-being.

One particular metric BCG report uses is growth-to-well-being coefficient on which Pakistan scores 0.87, higher than India's 0.77 and China's 0.75.

Big Poverty Decline Since 2002:

Using the old national poverty line of $1.90 (ICP 2011 PPP) , set in 2001, the percentage of people living in poverty fell from 34.7 percent in FY02 to 9.3 percent in FY14—a fall of more than 75 percent. Much of the socioeconomic progress reported by the World Bank since 2000 has occurred during President Musharraf's years in office from 2000-2007. It has dramatically slowed or stagnated since 2010.

Source: World Bank Report Nov 2016

Using the new 2016 poverty line of $3.50 (ICP 2011 PPP),  29.5 percent of Pakistanis as poor (using the latest available data from FY14). By back casting this line, the poverty rate in FY02 would have been about 64.3 percent.

Pakistan's new poverty line sets a minimum consumption threshold of Rs. 3,030 or $105 (ICP 2011 PPP) per person per month or $3.50 (ICP 2011 PPP) per person per day. This translates to between Rs. 18,000 and Rs. 21,000 per month for a household at the poverty line, allowing nearly 30% of the population or close to 60 million people to be targeted for pro-poor and inclusive development policies—thus setting a much higher bar for inclusive development.

Multi-dimensional Poverty Decline:

UNDP report released in June 2016 said Pakistan’s MPI (Multi-dimensional poverty index) showed a strong decline, with national poverty rates falling from 55% to 39% from 2004 to 2015. MPI goes beyond just income poverty.

The Multidimensional Poverty Index uses a broader concept of poverty than income and wealth alone. It reflects the deprivations people experience with respect to health, education and standard of living, and is thus a more detailed way of understanding and alleviating poverty. Since its development by OPHI and UNDP in 2010, many countries, including Pakistan, have adopted this methodology as an official poverty estimate, complementing consumption or income-based poverty figures.

Rising Living Standards of the Poorest 20% in Pakistan:

According to the latest World Report titled "Pakistan Development Update: Making Growth Matter" released this month, Pakistan saw substantial gains in welfare, including the ownership of assets, the quality of housing and an increase in school enrollment, particularly for girls.

First, the ownership of relatively more expensive assets increased even among the poorest. In the bottom quintile, the ownership of motorcycles increased from 2 to 18 percent, televisions from 20 to 36 percent and refrigerators from 5 to 14 percent.

In contrast, there was a decline in the ownership of cheaper assets like bicycles and radios.

Housing quality in the bottom quintile also showed an improvement. The number of homes constructed with bricks or blocks increased while mud (katcha) homes decreased. Homes with a flushing toilet almost doubled in the bottom quintile, from about 24 percent in FY02 to 49 percent in FY14.

Dietary Improvements for the Poorest 20% in Pakistan:

Decline in poverty led to an increase in dietary diversity for all income groups.

For the poorest, the share of expenditure devoted to milk and milk products, chicken, eggs and fish rose, as did the share devoted to vegetables and fruits.

In contrast, the share of cereals and pulses, which provide the cheapest calories, declined steadily between FY02 and FY14. Because foods like chicken, eggs, vegetables, fruits, and milk and milk products are more expensive than cereals and pulses, and have lower caloric content, this shift in consumption also increased the amount that people spent per calorie over time.

For the poorest quintile, expenditure per calorie increased by over 18 percent between FY02 and FY14. Overall, this analysis confirms that the decline in poverty exhibited by the 2001 poverty line is quite credible, and that Pakistan has done remarkably well overall in reducing monetary poverty based on the metric it set some 15 years ago, says the World Bank.

Summary:

In spite of Pakistan's many challenges on multiple fronts, the country has successfully translated its GDP growth into the well-being of its poorest citizens. "Pakistan’s recent growth has been accompanied by a staggering fall in poverty", says a November 2016 World Bank report.  An earlier report by Boston Consulting Group reached a similar conclusion.

Related Links:

Haq's Musings

Pakistan's Middle Class Larger and Richer Than India's

Pakistan Translates GDP Growth to Citizens' Well-being

Rising Motorcycle Sales in Pakistan

Depth of Deprivation in India

Chicken vs Daal in Pakistan

China Pakistan Economic Corridor

Views: 594

Comment by Riaz Haq on December 4, 2016 at 7:55am

How will #Pakistan economy fare in 2017? #CPEC #IMF #SBP
http://www.khaleejtimes.com/how-will-pakistan-fare-in-2017


Finance Minister Ishaq Dar is claiming that Pakistan's GDP growth will rise to even 5.7 per cent as compared to FY-16.

---

The SBP, the central bank, has just unveiled its SBP Annual Review - 2015-16, which sheds light on most aspects of the country's economy, and previews the microeconomic targets for FY-17 in the light of the actual performance in FY-16.

The GDP growth in FY-17 is set at 5.7 per cent, but the SBP expects it to a range between five and six per cent. "If a higher projection is achieved, it will so for the first time since 2007. It will also a signal that the economy has fundamentally moved up to a higher growth trajectory. The current indications, based on the first four months of FY-17, are that it may not happen because farm output is down and it is not likely to rise in whole of FY-17. The Large Scale Manufacturing industry, which showed a rise of just two per cent in July-September as compared to the target of the planned target of six per cent," said Dr Hafeez Pasha, the former Finance Minister of Pakistan, who currently heads Karachi-Pakistan based Institute of Business Administration (IBA).

With limited growth in sectors like industry, trade, exports and banking but construction and real estate going up, and if the present trends continue, "the GDP growth rate is unlikely to exceed four per cent. This is substantially below the SBP projection of five to six per cent growth rate," Dr Pasha said.

The government's inflation rate target is six per cent while the SBP projects it at 4.5 to 5.6 per cent in FY-17. The actual inflation in the first four months, July-October, it was four per cent. "As such, the inflation rate projection by SBP of some increase in the rate of inflation appears to be valid," Dr Pasha also said.

The SBP expects the current account deficit in the range of 0.5 to 1.5 per cent of the GDP in FY-17, while the government puts it at around 1.5 per cent. This optimism is based on the revival of exports by five per cent. In fact, exports in the first four months of this fiscal have declined by six per cent and home remittances sent by Pakistanis working overseas are down by one per cent. The current account deficit has widened by 6.3 per cent, and already has reached 0.6 per cent of GDP.

But, where is progress and prosperity ending up? This stark question stems from the independent research and analysis that clearly confirmed this week that poverty in Pakistan is, in fact, rising, despite all claims by the government and multilateral institutes about economic progress and growth.

Christine Lagarde, managing director of the IMF, endorsed the official view of the pro-poor analysts, during her visit to Pakistan this week. But, addressing bankers and economists, Lagarde asked Pakistan to do more for the poor. She said: "Although more than 1.5 million poor households are now benefiting from targeted social assistance than three years ago, more efforts are required to end the agonies of the poor."

"Applauding other good efforts of Prime Minister Nawaz Sharif's government, Lagarde pointed out that power outages have gradually decreased and the financial performance of the power sector is strengthening. A country-wide strategy to improve the business climate is being implemented," she said at a joint press conference with Finance Minister Ishaq Dar. She also urged Pakistan that "corruption or the perception of corruption can only be eradicated through honesty, transparency and accountability."

Comment by Riaz Haq on December 11, 2016 at 7:13am

#India's Central Bank Denied Its Big Payday As #Modi's #Demonetization Flops via @forbes

http://www.forbes.com/sites/wadeshepard/2016/12/10/indias-central-b...

Theoretically, by having a large amount of canceled banknotes going unredeemed the Indian government could essentially pocket the balance, which was estimated to be as high as 21% of the currency being recalled — or roughly $45 billion.

“Now it is not being explicitly stated — and in some cases they are going to deny it — but if a certain amount of cash does not come back then the central bank no longer has to account for that money,” said Arpan Nangia, the head of the India desk for HSBC’s commercial banking division. “So, for example, if a billion dollars does not come back then it's like a billion dollar profit for the central bank.”

Unfortunately for Modi and India’s central bank, this payday never materialized. As of now, over 82.5% of the recalled notes have been turned in, and it is estimated that by the time the redemption period is over on December 30th essentially all nullified notes will have been collected — white and black alike.

How the black market was able to take such large amounts of black money and redeem it via the demonetization program is not yet fully understood. Some theories have it that large amounts of previously inactive bank accounts were utilized or money was laundered via various tax-exempt entities. India’s Enforcement Directorate is currently investigating bank branches throughout the country.

However, India also offered an amnesty program for black market players, where the government would accept illicit cash at a 50% tax, and how much of the recovered notes were part of this program is currently unknown.

That said, all the “black money” that Modi and Company were attempting to wipe out may never have existed in the first place. Prior to this recent wave of demonetization, various studies have indicated that only 6% or so of India’s black market wealth is actually kept in cash. In 2012, India’s Central Board of Direct Taxes came out and publicly advised against demonetization on the grounds that most of country’s illicit wealth is kept in real estate, bullion, and jewelry — not in 500 and 1,000 rupee banknotes.

Comment by Riaz Haq on January 11, 2017 at 10:30pm

Here are 2014 median income/consumption estimates of countries around the world released by he Centre for Global Development:

https://www.givingwhatwecan.org/post/2016/05/giving-and-global-ineq...


Pakistan: Median Income per capita: $1204.50, Median Household Income: $6,022.50 Mean (Average) per capita $4,811.31 

India Rural: Median per capita $930.75 Median Household $4,653.75 Mean (Average) per capita $5,700.72 

India Urban: Median per capita $1295.75 Median Household $6,478.75 Mean(Average) per capita: $5,700.72


http://www.cgdev.org/blog/world-bank-poverty-statistics-lack-median...

Comment by Riaz Haq on March 6, 2017 at 4:34pm

#India’s court system offers little hope of #justice. #democracy #ruleOfLaw https://www.ft.com/content/e3e31e4e-0015-11e7-8d8e-a5e3738f9ae4 … via @FT


On a hot June afternoon in 1997, a fire broke out at New Delhi’s Uphaar cinema, which was full for the opening day of a Bollywood blockbuster. Smoke engulfed the hall, and 59 people, including children, died of asphyxiation. Most were trapped in the balcony, where one of the exits was blocked by the addition of extra seats, while the other doors were bolted shut from the outside.

Twenty years on, one of the two powerful property developers who owned the cinema hall — and pushed the controversial building modifications that turned it into a fire trap — has been imprisoned.

Gopal Ansal, and his elder brother Sushil, were convicted of criminal negligence leading to the fatalities back in 2007, and sentenced to two years in prison. They appealed, launching another decade of legal battles when judges repeatedly upheld the Ansals’ culpability but differed on the appropriate punishment.

Last month, a Supreme Court panel upheld the Ansal brothers’ conviction, and affirmed that Gopal, now 68, would be sentenced to a year’s imprisonment, due to start this week. His brother Sushil Ansal, now 76, was spared incarceration, with the judges citing his advanced years.

It was a galling outcome for parents such as Neelam and Shekhar Krishnamoorthy, who lost two children in the Uphaar fire and went on to become campaigners for justice. Worse may yet come. Gopal Ansal has filed a last-ditch appeal that he is also too old and ill to be imprisoned. 

New Delhi often touts the rule of law as a factor that distinguishes India from its richer neighbour China, and ostensibly makes it an attractive investment destination. But the Uphaar cinema case is a powerful reminder of how the rule of law is collapsing in India under a backlog of 33m criminal and civil cases, which one judge estimated would take 320 years to clear. 

Underpinning this breakdown is an acute shortage of judges, a severe problem in a society where litigiousness seems on par with the US. India has just 18 judges for every 1m people. Many fast-growing economies have between 35 to 40 judges per million people; in the US, it is more than 100. 

India’s judge shortage is exacerbated by many unfilled vacancies, the lack of modern technology in courthouses, lawyers’ deliberate delaying tactics to stall cases, and an abundance of relatively frivolous litigation. 

---

Among New Delhi’s demands is a new requirement that investors in India must exhaust all domestic legal remedies to resolve disputes before moving to international arbitration. What that could mean for foreign companies ensnared in disputes with local partners or Indian government entities can be seen in another recent Supreme Court verdict on a high-profile case from the same era as the Uphaar fire. 

In 1996 I wrote my first stories about the arrest for alleged corruption of the powerful Tamil Nadu chief minister Jayalalithaa, a film star turned politician who owned thousands of saris, hundreds of shoes, and a trove of precious jewellery. It drew comparisons with the Philippines’ Imelda Marcos. 

In 2014, 18 years after her arrest, Jayalalithaa was convicted of possessing assets exceeding her known sources of income. She spent 22 days in jail before being freed on bail pending her appeal. The Supreme Court effectively upheld her conviction last month, sentencing her long-time companion and co-accused, VK Sasikala, to four years in prison. The wheels of justice turned so slowly, however, that Jayalalithaa managed to elude them. She died last December.

Comment by Riaz Haq on June 11, 2017 at 7:28am

Facets of inequality (in Pakistan) by Sakib Sherani Op Ed in Dawn

WEALTH and income inequality have risen sharply around the world in the past few decades, with data suggesting an acceleration in the trend over the recent past. This state of affairs has occurred despite massive economic prosperity having been generated over the same period of time, which has lifted millions around the globe out of extreme poverty.

However, economic prosperity has not been shared equitably. According to Oxfam, “since 2015, the richest one per cent has owned more wealth than the rest of the planet”. Earlier this year, Oxfam reported that eight of the richest men in the world now owned the same amount of wealth as the poorest half of the world (3.6 billion people).

Between 1988 and 2011, incomes of the poorest 10pc increased by just $65 per person — or less than $3 annually — compared to the incomes of the richest 1pc which grew by $11,800 per person, or 182 times as much. In the US, the situation with regards to income inequality is even more extreme. According to research by the French economist Thomas Picketty, over the last 30 years the growth in the incomes of the bottom 50pc has been zero, whereas incomes of the top 1pc have grown 300pc.

The situation in Pakistan appears to have followed a similar trend. While the Planning Commission has stopped making public statistics on income inequality for the past few years, evidence suggests that the disparity between the richest and the poorest households has increased. According to the Household Integrated Economic Survey (HIES) 2015-16, the share of the top 20pc of households in overall income is nearly 45pc, while for the bottom 20pc the share is slightly less than 9pc — a multiple of 5 times.

Inequality has broader dimensions beyond wealth or income.

While looking at inequality through the prism of income or wealth distribution is instructive, it tells a less than complete story. For a country like Pakistan, the inequality in society is multidimensional — with deep structural as well as institutional roots. The poor and vulnerable are discriminated against, face exclusion and marginalisation in a structured and institutionalised manner. Hence, for a proper understanding of the issue, one has to map the broad areas and extent of ‘non-inclusion’ of citizens, not just the inequitable distribution of wealth/income.

https://www.dawn.com/news/1338328

Comment by Riaz Haq on September 12, 2017 at 8:21am

BBC News - #Inequality in #India is the highest level in 92 years. Top 1% take 22% of income. Top 1% own 58% wealth
http://www.bbc.com/news/world-asia-india-41198638#

New research by French economists Lucas Chancel and Thomas Piketty, author of Capital, the 2013 bestselling book on capitalism and increasing inequality, clearly points to this conclusion.
They studied household consumption surveys, federal accounts and income tax data from 1922 - when the tax was introduced in India - to 2014.
The data shows that the share of national income accruing to the top 1% of wage earners is now at its highest level since Indians began paying income tax.
The economists say the top 1% of the earners captured less than 21% of the total income in the late 1930s, before dropping to 6% in the early 1980s and rising to 22% today. India, in fact, comes out as a country with one of the highest increase in top 1% income share concentration over the past 30 years," they say.

To be sure, India's economy has undergone a radical transformation over the last three decades.
Up to the 1970s, India was a tightly regulated, straitlaced economy with socialist planning. Growth crawled (3.5% per year), development was weak and poverty endemic.
Some easing of regulation, decline in tax rates and modest reforms led to growth picking up in the 1980s, trundling at around 5% a year. This was followed by some substantial reforms in the early 1990s after which the economy grew briskly, nudging close to double digits in the mid-2000s.

Growth has slowed substantially since then, but India still remains one of the fastest-growing economies in the world. The ongoing slowdown - growth was 5.7% in the April-June quarter, the slowest pace in three years - largely triggered by feeble demand, a controversial cash ban, declining private investment and weak credit growth, is a cause for concern.
And the need for fast-paced growth, according to Nobel Prize winning economist Amartya Sen, is "far from over since India, after two decades of rapid growth, is still one of the poorest countries in the world".
From their latest work on income inequality, Lucas Chancel and Thomas Piketty contend that there has been a "sharp increase in wealth concentration from 1991 to 2012, particularly after 2002". Also, they conclude, India has only been really shining for the top 10% of the population - roughly 80 million people in 2014 - rather than the middle 40%.
The economists plan to release the first World Inequality Report, produced by a network of more than 100 researchers in December, where they will compare India's inequality with other countries and suggest ways to tackle it.
Striking transition
They agree that unequal growth over a period of time is not specific to India, but market economies are not bound to be unequal. India's case is striking in the fact that it is the country with the highest gap between the growth of the top 1% and that of the full population. Incomes of those at the very top have actually grown at a faster pace than in China.
The economists contend that the growth strategy pursued by successive governments has led to a sharp increase in inequality. China also liberalised and opened up after 1978, and experienced a sharp income growth as well as a sharp rise in inequality. This rise was however stabilised in the 2000s and is currently at a lower level than India.
In Russia, the move from a communist to a market economy was "swift and brutal" and today has a similar level of inequality to India.
"This shows that there are different strategies to transit from a highly regulated economy to a liberalised one. In the arrays of possible pathways, India pursued a very unequal way but could probably have chosen another path," Dr Chancel told me.

Comment by Riaz Haq on November 27, 2017 at 10:55pm

Credit Suisse Wealth Report 2017

India Average Wealth Per Capita $5,976 Gini 83% Household Wealth Up 9.9% since 2016

India Median Wealth Per Capita $1295

Pakistan Average Wealth Per Capita $5,174 Gini 52.6% Household Wealth Up 6.3% since 2016

Pakistan Median Wealth Per Capita $3,338


http://publications.credit-suisse.com/tasks/render/file/index

Comment by Riaz Haq on November 29, 2017 at 9:15am

Average number of adults per household in Pakistan 3.0 (out of 6.45) `vs India 2.5 (out of 4.9)

https://tribune.com.pk/story/1491353/census-2017-family-size-shrinks/

http://www.riazhaq.com/2017/09/pakistan-impact-of-labor-force.html

The average household wealth in Pakistan is $15,522 vs India $14,940

The median household wealth in Pakistan is $10,014 vs India $3,237

Credit Suisse Wealth Report 2017

India Average Wealth Per Capita $5,976 Gini 83% Household Wealth Up 9.9% since 2016

India Median Wealth Per Capita $1295

Pakistan Average Wealth Per Capita $5,174 Gini 52.6% Household Wealth Up 6.3% since 2016

Pakistan Median Wealth Per Capita $3,338

Comment by Riaz Haq on November 29, 2017 at 10:11am

Monday, November 20, 2017. Credit Suisse Wealth Report 2017
Indian inequality higher than Pakistan, China, Bangladesh; 92% adults' net worth less than $10,000; of 0.5% plus $100,000

http://www.counterview.net/2017/11/indian-inequality-higher-than-pa...

Indian inequality higher than Pak, China, Bangladesh; 92% adults' net worth less than $10,000; of 0.5% plus $100,000

By Our Representative
Giving a scary picture of inequalities in India, the recently-released “Global Wealth Report 2017”, published by Credit-Suisse, a Swiss multinational financial services holding company, headquartered in Zurich, has said that India’s 92% of adults “have net worth less than USD 10,000”, while “a small fraction of the population (just 0.5% of adults) has a net worth over USD 100,000.” 
While the 0.5% adult population of India “translates into 4.2 million people” because of its huge population, the report says, “By our estimates, 1,820 adults have wealth over USD 50 million, and 760 have more than USD 100 million.” 
A further breakup of wealth among the top echelons reveals that 10% of the adult population has 73.3% of wealth, 5% has 64.1% of wealth, and 1% has 45.1% of wealth. 
In absolute numbers, the report says, as of mid-2017, 770,089,000 adult individuals have a wealth range of under USD 10,000, 60,116,000 have a wealth range between USD 10,000 and 100,000, 4,158,000 have wealth range between USD 100,000-1 million, and 245,000 individuals have wealth more than USD 1 million. 
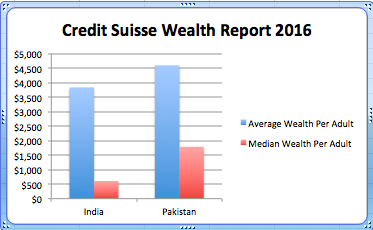
In USD
Pointing out that “while wealth has been rising in India, not everyone has shared in this growth”, the report’s data show that India’s Gini index – an internationally recognized, most commonly used measure of inequality, with 100% representing maximal inequality – is found to be 83%. By comparison, Pakistan’s Gini index is 52.6%, Bangladesh’s 57.9%, Sri Lanka’s 66.5%, Nepal’s 67.3%, and China’s 78.9%.
In fact, says the report, inequalities have risen alongside the total wealth in India increasing fourfold between 2000 and 2017, reaching USD 5 trillion in 2017, adding, “The country’s high wealth inequality and immense population mean that India also has a significant number of members in the top wealth echelons.”
At the same time, it notes, “Despite this remarkable increase and having four times the population of the United States, total wealth in India is comparable to the level for the United States 90 years ago”, adding, “We expect it to reach USD 6 trillion in real terms by 2022, which is comparable with the level in the United States in 1936. India could reach 370,000 millionaires in 2022, an increase of more than 50% in the next five years.”
According to the report, “Personal wealth in India is dominated by property and other real assets, which make up 86% of estimated household assets”, adding, “India is also notable for the rise in household debt, which we estimate to be close to 20% in terms of US dollars.” Thus, the debts per adult, the report’s figures show, have risen from USD 226 in 2007 to almost double as much, USD 609 in 2017.
Comment by Riaz Haq on January 11, 2018 at 2:39pm

#India’s Missing #MiddleClass : Multinational businesses relying on Indian consumers face disappointment. #China #Inequality

https://www.economist.com/news/briefing/21734382-multinational-busi...


https://twitter.com/haqsmusings/status/951542797483499520


For all the talk of wanting to tap the middle class, no firm moving into India thinks it is targeting the middle of the income distribution. India’s mean GDP per head is just $1,700, and 80% of the population makes less than that. Adjust for purchasing-power parity by factoring in the cheaper cost of goods and services in India and you can bump the mean up to $6,600. But that is less than half the figure for China (see chart 2) and a quarter of that for Russia. What is more, foreign companies have to take their money out of India at market exchange rates, not adjusted ones.

Defining the middle class anywhere is tricky. India’s National Council of Applied Economic Research has used a cut-off of 250,000 rupees of annual income, or about $10 a day at market rates. Thomas Piketty and Lucas Chancel of the Paris School of Economics found in a recent study that one in ten Indian adults had an annual income of more than $3,150 in 2014. That leaves only 78m Indians making close to $10 a day.

Meagre market

Even adjusting for the lower cost of living, that is hardly a figure to set marketers’ heartbeats racing. The latest iPhone, which costs $1,400 in India, represents five month’s pay for an Indian who just makes it into the top 10% of earners. And such consumers are not making up through growing numbers what they lack in individual spending power. The proportion making around $10 a day hardly shifted between 2010 and 2016.

Another gauge is whether people can afford the more basic material goods they crave. For Indians, that typically means a car or scooter, a television, a computer, air conditioning and a fridge. A government survey in 2012 found that under 3% of all Indian households owned all five items. The median household had no more than one. How many of them will be anywhere near able to buy an iPhone or a pair of Levi’s if they cannot afford a TV set?

To get in the top 1% of earners, an Indian needs to make just over $20,000. Adjusted for purchasing-power parity, that is a comfortable income, equating to over $75,000 in America. But in terms of being able to afford goods sold at much the same price across the world, whether a Netflix subscription or Nike trainers, more than 99% of the Indian population are in the same league as Americans that count as below the poverty line (around $25,000 for a family of four), points out Rama Bijapurkar, a marketing consultant.

The top 1% of Indians, indeed, are squeezing out the rest. They earn 22% of the entire income pool, according to Mr Piketty, compared with 14% for China’s top 1%. That is largely because they have captured nearly a third of all national growth since 1980. In that period India is the country with the biggest gap between the growth of income for the top 1% and the growth of income for the population as a whole. At the turn of the century, the richest 10% of Indians made 40% of national income, about the same as the 40% below them. But far from becoming a middle class, the latter’s share of income then slumped to under 30%, while those at the top went on to control over half of all income (see chart 3).

Comment

You need to be a member of PakAlumni Worldwide: The Global Social Network to add comments!

Join PakAlumni Worldwide: The Global Social Network

Pre-Paid Legal


Twitter Feed

    follow me on Twitter

    Sponsored Links

    South Asia Investor Review
    Investor Information Blog

    Haq's Musings
    Riaz Haq's Current Affairs Blog

    Please Bookmark This Page!


    Blog Posts

    Pakistani Student Enrollment in US Universities Hits All Time High

    Pakistani student enrollment in America's institutions of higher learning rose 16% last year, outpacing the record 12% growth in the number of international students hosted by the country. This puts Pakistan among eight sources in the top 20 countries with the largest increases in US enrollment. India saw the biggest increase at 35%, followed by Ghana 32%, Bangladesh and…

    Continue

    Posted by Riaz Haq on April 1, 2024 at 5:00pm

    Agriculture, Caste, Religion and Happiness in South Asia

    Pakistan's agriculture sector GDP grew at a rate of 5.2% in the October-December 2023 quarter, according to the government figures. This is a rare bright spot in the overall national economy that showed just 1% growth during the quarter. Strong performance of the farm sector gives the much needed boost for about …

    Continue

    Posted by Riaz Haq on March 29, 2024 at 8:00pm

    © 2024   Created by Riaz Haq.   Powered by

    Badges  |  Report an Issue  |  Terms of Service