PakAlumni Worldwide: The Global Social Network
The Global Social Network
India Fudging GDP Figures to Look Better Than China?
Indian government now claims that the country's GDP grew by 6.9% in 2013-14, well above the 4.7% growth the country had announced earlier.
Based on the latest methodology, it is claimed that the Indian economy expanded 7.5 percent year-on-year during the last quarter, higher than 7.3 percent growth recorded by China in the latest quarter, making it the fastest growing major economy in the world, according to Reuters. Is it wishful thinking to make Indian economy look better than China's?
|
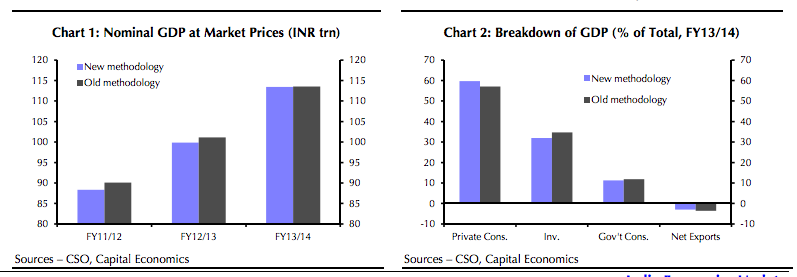
The GDP revisions have surprised most of the nation's economists and raised serious questions about the credibility of government figures released after rebasing the GDP calculations to year 2011-12 from 2004-5. So what is wrong with these figures? Let's try and answer the following questions:
1. How is it possible that the accelerated GDP growth in 2013-14 occurred while the Indian central bankers were significantly jacking up interest rates by several percentage points and cutting money supply in the Indian economy?
2. Why are the revisions at odds with other important indicators such as lower industrial production and trade and tax collection figures? For the previous fiscal year, the government’s index of industrial production showed manufacturing activity slowing by 0.8%. Exports in December shrank 3.8% in dollar terms from a year earlier.
3. How can growth accelerate amid financial constraints depressing investment in India? Indian companies are burdened with debt and banks are reluctant to lend.
4. Why has the total GDP for 2013-14 shrunk by about Rs. 100 billion in spite of upward revision in economic growth rate? Why is India's GDP at $1.8 trillion, well short of the oft-repeated $2 trillion mark?
Questions about the veracity of India's official GDP figures are not new. These have been raised by many top economists. For example, French economist Thomas Piketty argues in his best seller "Capital in the Twenty-First Century that the GDP growth rates of India and China are exaggerated. Picketty writes as follows:
"Note, too, that the very high official growth figures for developing countries (especially India and China) over the past few decades are based almost exclusively on production statistics. If one tries to measure income growth by using household survey data, it is often quite difficult to identify the reported rates of macroeconomic growth: Indian and Chinese incomes are certainly increasing rapidly, but not as rapidly as one would infer from official growth statistics. This paradox-sometimes referred to as the "black hole" of growth-is obviously problematic. It may be due to the overestimation of the growth of output (there are many bureaucratic incentives for doing so), or perhaps the underestimation of income growth (household have their own flaws)), or most likely both. In particular, the missing income may be explained by the possibility that a disproportionate share of the growth in output has gone to the most highly remunerated individuals, whose incomes are not always captured in the tax data." "In the case of India, it is possible to estimate (using tax return data) that the increase in the upper centile's share of national income explains between one-quarter and one-third of the "black hole" of growth between 1990 and 2000. "
Related Links:
India-Pakistan Economic Comparison 2014
Challenging Haqqani's Op Ed: "Pakistan's Elusive Quest For Parity"
State Bank Says Pakistan's Official GDP Under-estimated
Pakistan's Growing Middle Class
Pakistan's GDP Grossly Under-estimated; Shares Highly Undervalued
Fast Moving Consumer Goods Sector in Pakistan
Views: 661
-
Comment by Riaz Haq on February 9, 2015 at 5:02pm
-
Even the RBI’s Rajan is Confused by India’s New GDP Numbers
India’s statistics ministry dropped a bombshell revision of recent GDP data Friday evening, provoking some head-scratching among economists trying to make sense of the incredible (in both senses of the word) new numbers. Growth of 6.9% in the 2014 fiscal year instead of 4.7%!
Had we all been “horribly wrong” about the Indian economy? Was the previous, Congress party-led government voted out on specious premises? Were the data fudged?
On Tuesday, Raghuram Rajan kept a cooler head.
“I don’t want to say anything about the numbers until we understand them better,” the Reserve Bank of India governor told reporters after announcing his decision to hold the policy interest rate at 7.75%. He said it would be “premature to take a strong view” based on the updated data. The central bank also kept its forecast for GDP growth for the year that ends next month at 5.5%—and, notably, continued to report the forecast using the old base year.
GDP growth in a year that ended nearly 11 months ago might not be the most immediately pertinent data point for deciding today’s monetary policy. But Mr. Rajan’s hesitation about embracing the new figures at least shows that policy makers aren’t junking their old narratives about the economy until the new GDP methodology yields a more-complete picture of recent trends.
Mr. Rajan, like others, pointed to the preponderance of other data that show continued stagnation that year: falling imports, sluggish auto sales. “We find it hard to see the economy as rollicking in 2013-14,” he said.
“I am puzzled by the new GDP growth numbers,” said Arvind Subramanian, the government’s chief economic adviser, in an interview with the Business Standard newspaper. He noted that the year that ended March 2014 was a crisis year for India, the year of the “taper tantrum,” capital outflows, the roiled rupee and RBI monetary tightening.
“I am not saying these [GDP] estimates are wrong in any way, only that these bear further scrutiny,” Mr. Subramanian said.
Of course, it’s not as if the RBI could have changed its forecasts on a dime even if it had wanted to. Most industrial-grade models used for such purposes rely on quarterly data to assess the dynamics of the economy.
Rudrani Bhattacharya of the National Institute of Public Finance and Policy in New Delhi said that with only the revised 2012-13 and 2013-14 annual growth rates available so far, the best she can do is use some simplistic assumptions to generate a quick-and-dirty revised forecast: “a mere scenario analysis,” she said.
Next Monday’s data release—when we’ll get GDP for each of the last three quarters as well as an advance estimate of growth for the whole fiscal year—is still the one to watch
http://blogs.wsj.com/indiarealtime/2015/02/03/even-the-rbis-rajan-i...
-
-
Still confused about those sizzling new economic-growth figures coming out of India? You’re not alone.
The country’s Central Statistical Office invited analysts and economists to a daylong workshop in New Delhi this week, hoping to explain and clarify the recent revisions to its methodology for estimating gross domestic p....
Those revisions suddenly caused India’s projected growth rate to shoot past China’s, which in turn thrust the nuts and bolts of India’s GDP calculation into the spotlight. Officials were pelted with questions as they walked through the new data sources, the updated surveys, the tweaked methods of extrapolating and scaling and counting.
AdvertisementMuch of the information about the new GDP method had already been made public in a144-page document released last month. But who has the time? Here are some highlights.
1. In India, all cars used to be equal. In earlier Indian GDP data, the key manufacturing indicator was the monthly index of industrial production, which is based on the total quantity of output in a sample of a few thousand factories.
“The problem is that Marutis and Audis are all put together as the same,” said Ashish Kumar, director-general of the Central Statistical Office. In other words, by gauging only the volume of production, the old series was overlooking changes in monetary value brought about by product improvement and differentiation.
In the old GDP series, a yearly survey of industrial firms supplemented the production index when it became available. But that survey, too, has a limitation: Because it measures activity at the factory level, it doesn’t account for the marketing, development, logistics and financial-planning activities that take place at manufacturing firms’ head offices.
“In the earlier series, we were not capturing this,” Mr. Kumar said. “Because we never had access to any such information.”
The new GDP series therefore incorporates a new database of company balance sheets from the Ministry of Corporate Affairs. For the year ended March 2012, the database includes information from more than 500,000 firms. A central-bank study that had been used previously to gauge corporate activity covered fewer than 2,500 companies.
The impact on final growth rates is huge—and still slightly hard to swallow. In the 12 months that ended March 2013, manufacturing expanded 6.2% in the new GDP series, compared with 1.1% in the old. And in the following year, for which the old series had shown a 0.7% contraction, the new series has manufacturing growing by 5.3%.
2. All workers used to be equal, too. Well, at least for gauging activity in the informal economy. Small, unregistered companies—a major chunk of the Indian economy—typically employ unpaid helpers in addition to owners and hired workers. But before, these firms’ output was being estimated by taking the total number of workers and multiplying by per-capita added value.
No longer. The new GDP series uses an “effective labor input” method, which assigns different weights to different kinds of workers based on their productivity. The chart is here:

- Central Statistical Office
3. Agriculture isn’t just about crops, and livestock isn’t just about meat. Two major changes in the agricultural component of the new GDP series have to do with livestock. The first is a new way of valuing “meat byproducts.” State governments had been failing to provide direct data on the values and quantities of animals’ heads, legs, fat and skin on a “systematic and regular basis.” So, thanks to a study by the National Research Center on Meat, in Hyderabad, these are now being recorded simply as a share of the total value of the animals’ flesh.
Here’s the chart:

- Central Statistical Office
Yum. “EOG” stands for “edible offals and glands.”
The second major change to livestock measurement has to do with a different kind of byproduct. “For the first time, we have included the evacuation rate of goats and sheep in the production of organic manure,” said Sunil Jain, a deputy director-general at the statistics office.
Translation: Using a study on how much those animals defecate, statisticians have added that particular kind of biological output to their economic value.
The estimated “evacuation rates” are 0.3 kilograms per day for goats and 0.8 kilograms per day for sheep. The study, titled “Positive Environmental Externalities of Livestock in Mixed Farming... was conducted jointly by the Central Institute for Research on Goats, in Makhdoom, Uttar Pradesh, and the National Center for Agricultural Economics and Policy Research in New Delhi.
With all those “droplets” added in, the value of India’s livestock sector in the new GDP series is 9.1 billion rupees, or $150 million, higher than it was in the old series.
Why did the Central Statistical Office choose to start counting droplets? “It is based upon the observation of the farmers that, ‘OK, if I have to increase the fertility of my soil, I would request a shepherd to leave many animals in my field for a week,’ ” Mr. Jain said.
4. Finance is still a pretty new industry in India. Or at least measuring the financial industry is pretty new.
In the previous GDP series, the industry had two main components: banking, which made up 80.1% of added value in the sector, and insurance, which made up the rest. In fact, in the official guide to the old GDP figures, the financial industry was called just that: “Banking and Insurance.”
By contrast, the new GDP series includes separate measurements of stock exchanges and stock brokers. It counts the growing plethora of private investment funds available to Indians. In the old GDP figures, UTI, the formerly government-managed investment vehicle, had been the sole mutual or money-market fund being measured. The Employees’ Provident Fund Organization, the state-run social-security program, was the only pension fund.
Not even informal finance, hardly a recent scourge in poorer corners of India, was being estimated separately before the latest GDP series. It was just assumed to be one-third the size of the formal, non-bank financial industry. Now, private moneylenders’ contribution to the economy is measured using survey data from the central bank.
5. Hoarding gold is now officially virtuous. In the new GDP series, households’ expenditure on gold and silver ornaments is treated as part of their savings instead of their consumption. The value of such savings, in the year ended March 2012, was recorded at 340 billion rupees, or $5.4 billion—which, despite Indians’ infamous appetite for gold, represented only 1% of total savings in the economy that year.
6. When it comes to timely economic data, India is still far, far behind rich countries.The biggest obstacle to measuring the Indian economy is how much of it is informal: cash-based, outside the tax net and leaving no paper trail. Two-thirds of India’s nonfarm workforce are employed this way.
With measurements on such a large portion of the economy available only via surveys conducted once every five years—less often in some cases—Indian statisticians invariably rely on various workarounds to produce yearly GDP numbers. For the informal economy, the new series uses tax and corporate data instead of blunter indexes of production to project survey findings forward.
That’s ostensibly an improvement. But India’s data deficiencies don’t end there.
In rich countries, GDP can be triangulated: Whether you tally up the value of what’s produced, the money that is spent to buy that production or the income earned from selling it, the total should be the same. Not so in India, where only production data are considered reliable.
Data on securities and other financial instruments are underdeveloped as well. India doesn’t have regular statistics on employment.
“There’s a large number of areas where we have deviated” from the United Nations’ latest guidebook on measuring GDP, said T.C.A. Anant, who holds the title of chief statistician of India—“for a large measure, because we are simply, at the moment, unable to implement those recommendations.”
http://blogs.wsj.com/indiarealtime/2015/04/17/indias-new-gdp-number...
-
-
India’s Finance Mnister Arun Jaitley forecast exactly a month ago that the country’s GDP growth rate will be 7.5 percent this year. He attributed this entirely to the dynamism of the government led by Prime Minister Narendra Modi formed after the 2014 parliamentary poll. “During the last few years we had fallen off the radar, our growth had slowed down, our priorities were blurred and the world was accusing us of policy paralysis. Finally people of India decided to bring about a change”, Jaitley said in a thinly veiled condemnation of the previous government led by Prime Minister Manmohan Singh, an acclaimed economist himself, who is credited with piloting the country’s free-market reforms.
“This year we will close at 7.5 percent GDP growth and next year hopefully higher,” Jaitley predicted. Jaitley is a no-nonsense lawyer by profession and is a successful politician. To be sure, as India’s finance minister, his words carry weight within the country and abroad.
They influence even the IMF, which has since acclaimed that India is poised to “overtake” China in growth. That’s a tongue-in-cheek remark, of course, because who doesn’t know that China’s economy has outstripped India’s by four decades or more already and comparing India with China is no more than a folk tale. But then, perceptions form the stuff of our day-to-day life and most of us Indians are not trained economists.
Unsurprisingly, the widespread perception in India today is that the country has finally caught up with China in growth and development. For a country smitten by a keen sense of envy bordering on rivalry vis-a-vis China, this easily transmutes as the stuff of national pride. And Prime Minister Narendra Modi suddenly looks ten feet tall.
Even President Barack Obama took note, which was only to be expected since the lure of the fastest growing market in the world is there on his mind always. The Indian market is important for boosting US exports and creating jobs in America and it could not have escaped Obama’s highly focused mind.
Obama probably thought it will be a clever move on his part to pen a panegyric on Modi. There couldn’t be a better way of flattering Modi, after all. And, believe it or not, amidst all that ugly, exasperating wrangle with the US Congress over the Iran deal, Obama was quietly writing a panegyric on Modi!
But nothing works well for Obama thse days and the Time magazine’s piece by the US president on Modi, which appeared yesterday, however, turned out to an overkill that might even embarrass Modi, who usually likes flattery.
Obama probably thought it pays to cater to Modi’s vanities, since he knows Modi can take arbitrary decisions and that can be useful for promoting American business interests. But he stepped way out of line by bracketing Modi with Martin Luther King and Mahatma Gandhi. The point is, like what the famous song supposedly about Sophia Loren says, Obama never looked inside Modi’s head.
Obama’s panegyric most certainly inspired Jaitley to exceed his own month-old prophecy. He now believes that India has the potential to make nine to 10 percent growth rate “a new normal.” He made this prophecy at a US-India business conclave organized by a Washington-based think tank.
If Obama gets to hear what Jaitley just announced, maybe, he will now do an oil painting of Modi. Anything is possible. Obama has a focused mind.
To be sure, Jaitley has proved to be a past master in the ancient Indian rope trick. He has done a masterly job in stringing the public opinion and duping Obama by creating the misperception that under Modi’s magical touch, Indian economy has turned the corner and is zipping ahead.
http://atimes.com/2015/04/how-india-bettered-chinas-growth-story/
-
-
Meanwhile, the Indian rupee has lost 5.8% this year against the U.S. dollar, while the Brazilian real is down 31% and the Russian ruble is down 13%. The Chinese yuan is down 2.6%, but the currency has been propped up by Beijing despite an Aug. 11 devaluation, the most significant downward adjustment since 1994.
Stocks also paint a less painful picture for India.
India’s S&P BSE Sensex has fallen around 8% since the beginning of June. China’s stock market started tumbling in mid-June as local investors worried about the country’s high level of debt and its growth prospects. China’s Shanghai Composite Index has lost nearly 30% from the start of June through Wednesday, while Hong Kong’s Hang Seng Index, where foreigners can invest freely, has lost 19% over that period and Brazil is down about 10%.
To be sure, investors have been disappointed by India’s economy and the pace of reforms since the government of Narendra Modi came to power in May 2014. In anticipation of stronger growth and policy overhauls, the Sensex had gained nearly 30% in 2014, making it one of the best-performing major markets in the world.
Though India’s gross domestic product grew at a 7% rate for the April-to-June quarter, versus 5.7% growth in the same period in 2014, analysts attribute that partly to a change in the way the growth data are calculated. Company profits have barely grown, and now analysts say it could be another year or more before earnings pick up substantially.
The outflow of funds from India last month, surpassing even those from Brazil, a country facing more fiscal and economic challenges, partly reflects that disappointment.
Brazil had outflows of $940 million from its stock market, according to the Institute of International Finance. South Africa, another big emerging market, posted a net inflow of $190 million in August. Those data aren’t available for China and Russia, the IIF says.
To some degree, however, India was hurt by its own popularity. When global investors want to reduce their risky investments, they tend to sell stocks that are most liquid and have performed well.
http://www.wsj.com/articles/investors-see-india-as-strongest-of-the...
-
-
Falling #Indian exports raise questions about #Modi's #GDP growth claims and Make in #India http://blogs.timesofindia.indiatimes.com/minorityview/falling-expor... …
The slump in exports by 20.1% in August seems to have finally set alarm bells ringing as the exporters are now demanding that both the prime minister and commerce minister step in to help and prop up the sector. The demand is reasonable given that exports have now fallen for the ninth consecutive months dragging down total exports by 16.2% in April-August 2015-16. It is also worrisome because the fall in exports have now stretched into the second year having already fallen by a marginal 1.2% in 2014-15.
So far the government has tried to cover up the discordant trends on the trade front by pointing to the steady improvement in the current account deficit numbers which have now fallen to around 1.2% in the most recent quarter after peaking at above 5% just a few years back. However, the fall in current account deficit has little to do with export performance as it happened largely to the slump in oil prices and the restraints placed on gold imports.
But now the scenario has deteriorated far below acceptable levels. Exports as a percentage of the GDP has fallen from a high of 16.8% of the GDP in 2011-12 to 15.4% in 2014-15. The fall in goods exports has substantial repercussion not only on growth of the economy and also on the NDA governments much vaunted Make in India programme. Studies have pointed out that few countries have been able to grow at 7% plus growth rates based on domestic demand alone.
Numbers for the first five months of the year show that the fall in exports have been across board. Asia, which is India’s largest export market accounting for almost half the total exports, has been badly effected with exports declining by 16.2%. The scenario was no different in the EU, our second largest export market that accounts for close to a fifth of our imports, which also saw exports decline by 10.5%. Worse effected was West Asia our third largest market where exports fell by 16%. Markets in Asean also registered a fall of 22.7%. The only consolation was the exports to USA, which accounts for 16% of our total exports, registered a minimal fall of 1.1%.
http://blogs.timesofindia.indiatimes.com/crowdsourced/falling-expor...
-
-
#India's #poverty is understated and its #GDP is exaggerated, says #Nobel Prize winner Angus Deaton. #BJP #Modi http://www.ibtimes.co.in/indias-poverty-understated-says-nobel-priz... …
Deaton, however, believes that the poverty rates could be even higher. There is surely some omission in the surveys, which would mean that poverty is understated", Deaton told Hindustan Times in an interview.
He also said that the economic growth in India is not as high as the government presents it to be. India is said to be world's fastest-growing economy at 7 per cent growth rate.
"Everyone's data can be improved. I think it is widely recognized that the national accounts in India are relatively weak. So what I am most worried about is that growth is not as high as the accounts show. Revisions that increase growth are more readily accepted than revisions that reduce growth. So I am more worried about growth being overstated than poverty being understated," he added.
According to Deaton, the Indian government needs to invest more in nutrition, health and education of the young generation of the nation if it wants to overcome the growing poverty rate.
"Yes, though there are organizational and capacity problems that need to be overcome. In places where services don't work, for example, because of absenteeism, putting in more money is unlikely to help. But if other states can emulate the better services in the south, with more people demanding health and education, then we can make progress, and to do that, we will eventually need more money," he said.
Deaton, the Princeton University Professor, has done a thorough analysis of consumption and poverty in India. He contributed majorly to estimating India's poverty rate in 1990s with his work on India's malnutrition.
-
-
French Economist-Author Thomas Piketty to #India’s "Hypocritical" "Self-Serving" Elite: ‘Learn From History’ http://nyti.ms/1lQ5b4z
After he fled to the authors’ lounge, Mr. Piketty told me that he found the elite of India “hypocritical” for urging their government to address inequality by pouring resources into economic development, like building infrastructure or helping selected industries. This is self-serving, he says, and only increases the gap between the rich and the poor. In his opinion, governments should find the means to invest more in social welfare, like primary education and health care.
Before the world wars, he said, “the French elite used to say the same things that the Indian elite now say, that inequality would be reduced with rising development.” But after the wars, he said, the French began to see that direct investment in welfare was the way forward.
“I hope the Indian elite learn from the stupid mistakes of the other elites,” he said. “Learn from history.”
India is just emerging from what many regard as a catastrophic experiment in a type of socialism, the sort that economists like Amartya Sen, the Nobel laureate, say was not socialism in the first place, because it neglected health care and primary education. What the Indian elite learned from that history was to fear and loathe the idea of the welfare state.
In 1991, India reached the nadir of an economic crisis that forced it, in exchange for a financial rescue from the International Monetary Fund, to begin liberalizing its economy along the free market lines that were championed then by Washington. In the years that followed, the rich and the educated benefited the most, though the poor are better off today than they were before those changes.
Having prospered in recent decades, the Indian elite have faith in this economic model. But there is also a wide acceptance that India’s inadequate investments in education and health are holding the nation back.
“The problems India is trying to solve are problems other countries are trying to solve,” Mr. Piketty had said during his lecture. “India is trying to solve very complicated problems.”
-
-
Off balance: #India’s twin balance-sheet problem. Credit slump amid rising non-performing loans. http://www.economist.com/news/finance-and-economics/21717988-fast-g... … via @TheEconomist
IF INDIA is indeed the world’s fastest-growing big economy, as its government once again claimed this week, no one told its bankers and business leaders. In a nation of 1.3bn steadily growing at around 7% a year, the mood in corner offices ought to be jubilant. Instead, firms are busy cutting back investment as if mired in recession. Bank lending to industry, growth in which once reached 30% a year, is shrinking for the first time in over two decades (see chart). If this is world-beating growth, what might a slowdown look like?
India’s macroeconomy chugs along (though the quality of government statistics remains questionable), but its corporate sector is ailing. The sudden and chaotic “demonetisation” of 86% of bank notes in November hardly helped. But the origins of India’s troubles go much deeper. After India dodged the worst of the financial crisis a decade ago, a flurry of investment was made on over-optimistic assumptions. Banks have been in denial about the ability of some of their near-bankrupt borrowers to repay them. The result is that the balance-sheets of both banks and much of the corporate sector are in parlous states.
After years of burying their heads in the sand, India’s authorities now worry that its “twin balance-sheet” problem will soon imperil the wider economy. Both the Reserve Bank of India (RBI) and the government have nagged banks to deal with their festering bad loans. Around $191bn-worth, or 16.6% of the entire banking system, is now “non-performing”, according to economists at Yes Bank. That number is still swelling.
Given the linkages between them, companies and banks often run into trouble concurrently. But countries where banks’ balance-sheets resemble Swiss cheese usually have no choice but to deal with the issue promptly, lest a panicked public start queuing up at ATMs. India is different. State-owned lenders make up around 70% of the system, and nobody thinks the government will let them go bust. As a result, what for most economies would be an acute crisis is in India a chronic malaise.
That doesn’t make it any less painful. Investment is a key component of GDP, and it is now shrinking, thanks to parsimonious firms. India runs a trade deficit and the government is seeking to cut its budget shortfall, which leaves consumption as the sole engine of economic growth. Indeed, until demonetisation, consumer credit was booming, up by about 20% year on year. Some may wonder whether those are tomorrow’s bad loans, or when consumers will run out of stuff to buy.
Meanwhile, banks’ profits are sagging, even without the impact of fully accounting for dud loans. State-owned lenders collectively are making negative returns. Thirteen of them are described in a recent finance-ministry report as “severely stressed”. Demonetisation did indeed bring in lots of fresh deposits, but the bankers were then browbeaten into slashing the rates at which they lend, further denting their margins.
The dearth of investment is in part due to a lack of animal spirits. Sales outside the oil and metals sector are up by a mere 5% year on year, compared with nearer 25% at the start of the decade. Capacity utilisation, at 72.4%, is low by historical standards: even if money were available, it is not clear many would want to borrow.
Bankers, companies and policymakers once hoped the twin balance-sheet problem would eventually solve itself. Everyone’s incentive has been to look away and hope economic growth cures all ills. It has not: profits are in fact shrinking at the large borrowers, many of them in the infrastructure, mining, power and telecoms sectors. But banks have cut credit across the board, including to small businesses.
-
-
From being world leader in surveys, #India is now facing a serious #data problem: NSS #GDP estimate half of CSO's
http://blogs.economictimes.indiatimes.com/et-commentary/from-being-...
The National Sample Survey (NSS), when launched by the NSSO in 1949, was the most ambitious household survey in the world, covering over 1,800 villages and over 100,000 households across India. The methods used by the NSS became the standard for household surveys the world over.
For example, the use of inter-penetrating samples — essentially, two independent samples drawn from the same population — to test the reliability of the survey results, was developed by Mahalanobis in a 1936 paper and remains a standard tool for survey design. The Living Standard Measurement Surveys the World Bank still carries out in many countries are a direct descendent of the NSS.
We quibble about whether growth was 7.1% or 7.4%, ignoring the fact that our two main sources of official consumption data, the NSS and the GDP data produced by the Central Statistical Organisation (CSO), now tell entirely different stories.
If you believe the NSS, GDP could be just about half of what it is according to the CSO. There are occasional academic debates about which one is correct, which no one in power pays any attention to. And yet, it is almost surely true that both estimates (and their growth rates) are off by a huge margin. More worrying, this divergence has been known for nearly 50 years (though it has grown a lot).
And though we are occasionally told that the NSS is understaffed, or that no one knows where the CSO got a particular number, there is absolutely no political interest in improving things. From being the world leader in surveys, we are now one of the countries with a serious data problem while people talk about the really good data you can get in Indonesia or Brazil or even Pakistan.
-
-
Why #India’s '#Modi-fied' #GDP Math Lacks Credibility: How can #India's gdp growth rate be faster under #Modi government when its investment-to-gdp is down from 38% under UPA #Manmohansingh government to 30.3% now? How's capital-to-output ratio way up? https://thewire.in/political-economy/why-indias-new-gdp-math-lacks-...
India’s back-series GDP (gross domestic product) data, released by the NITI Aayog just four months before the 2019 general elections, turns the basic laws of macroeconomics on their head.
Here’s one that is most intriguing. The data shows lower GDP growth during the UPA years, which is when the gross investment to GDP ratio was peaking at 38%. And conversely, it shows higher GDP figures during the four years of Modi-led NDA-II government, which is when the gross investment to GDP ratio was at its lowest, at 30.3%.
Economic theory has always held that higher investments lead to higher GDP. So how can GDP grow faster when the investment-to-GDP ratio has fallen?
Technically, the only circumstance in which this can happen is when the economy’s productivity or the ‘Incremental Capital Output Ratio’ (ICOR) improves equally dramatically. Simply put, it means the economy generates a lot more output for the same amount of capital employed. There is no sign of that happening during the Modi government’s four years in which productivity was in fact negatively impacted by the twin shocks of demonetisation and messy GST implementation. Besides this, much of the NDA-II period has also seen the largest quantum ever of unproductive assets locked up in the form of non-performing assets (NPAs). Banks are not lending because of unresolved bad loans. How can productivity surge in such circumstances?
Says Mahesh Vyas, CEO of the Centre for Monitoring Indian Economy, a reputed private data research firm, “The new GDP back series numbers show India to be a magical economy where when the investment ratio drops sharply, the economy accelerates sharply. During the period (2007-08 to 2010-11) when the investment to GDP ratio was peaking at average 37.4% the average GDP growth was 6.7%. And in the recent four years (2014-15 to 2017-18) when the investment ratio was down to 30.3% the economy was sailing at 7.2%. Is this productivity magic?” There is really no answer to this fundamental questIon.
Former head of the Central Statistics Office (CSO) and chairman of the National Statistical Commission, Pronab Sen, is known to have a great feel for data and has been one of India’s foremost economists and chief statisticians. Sen has been critical of the manner in which the back-series data was essentially released by NITI Aayog and not by the CSO alone, as has been the practice in the past. This is tantamount to politicising institutions which deal with national statistics.
That apart, Sen also agrees that the back-series data does not pass the basic smell test linked to ground realities. While better productivity can theoretically produce higher output with the same quantum of capital or labour, he argues that the period of 2005-2012 also saw a big communication revolution in India due to mobile penetration. Consequently, it would be difficult to argue lower productivity in the UPA era. The service sector overall – whether communications, banking, real estate or hotels – clearly boomed during the UPA period.
Significantly, average GDP growth has been lowered to 6.7% during the UPA period in the new series, from over 8% in the earlier series, largely based on adjusting the service sector output (which was the biggest contributor to GDP) to lower levels.
There are other basic common sense tests which the new series fails. For instance, UPA-era growth is supposed to be lower even though the country’s exports were booming at 20%-plus, bank credit to industry grew at over 20% and the corporate earnings of the top 1,100 companies grew at at over 20%.
Twitter Feed
Live Traffic Feed
Sponsored Links
South Asia Investor Review
Investor Information Blog
Haq's Musings
Riaz Haq's Current Affairs Blog
Please Bookmark This Page!
Blog Posts
Pakistan Joins China in World AI Cooperation Organization (WAICO)
On July 16 in Shanghai, 29 countries, including China, Pakistan and Russia, signed the founding agreement of WAICO, World AI Cooperation Organization. Every BRICS founding member is in, except India. This agreement follows the launch of the US-led Pax Silica, a 24-member coalition, including India, which is designed to counter China's AI efforts. The stated goal of both these competing groups is to provide global governance, including building guardrails and setting…
ContinuePosted by Riaz Haq on July 20, 2026 at 6:26pm — 11 Comments
Is Rapid Electrification Stimulating Pakistan's Economy?
Pakistan's electricity demand has soared 21% in just two years. Rapid electrification is positively impacting all sectors of Pakistan's economy. thanks to growing deployment of distributed solar, estimated at 38 GW as of June, 2025. In 2025, 44% of solar deployment was residential, followed by industry (26%), agriculture (21%) and commercial users (9%). It is stimulating demand for a variety of products ranging from air conditioners and refrigerators to washing machines and…
ContinuePosted by Riaz Haq on July 13, 2026 at 5:09pm — 2 Comments
© 2026 Created by Riaz Haq.
Powered by
![]()
You need to be a member of PakAlumni Worldwide: The Global Social Network to add comments!
Join PakAlumni Worldwide: The Global Social Network