PakAlumni Worldwide: The Global Social Network
The Global Social Network
Pakistan At 75: Highlights of Economic and Demographic Progress Since Independence
Pakistan is a young nation with a lot of unrealized potential. As the country turns 75, it is important to recognize that all basic indicators of progress such as income, employment, education, health, nutrition, electricity use, telecommunications and transportation have shown significant improvements over the last seven and a half decades. These improvements can be accelerated if Pakistan can overcome its economic growth constraints from recurring balance of payments crises such as the one it is experiencing now. The only way to do it is through rapid expansion of exports and major reductions in reliance on imports such as fossil fuels and cooking oil.
Income/GDP Growth:
Economic Survey of Pakistan 2021-22 confirms that the nation's GDP grew nearly 6% in fiscal year 2021-22, reaching $1.62 Trillion in terms of purchasing power parity (PPP). It first crossed the trillion dollar mark in 2017. In nominal US$ terms, the size of Pakistan's economy is now $383 billion. The country's per capita income is $1,798 in nominal terms and $7,551 in PPP dollars.
 |
| Pakistan GDP, Per Capita Income Growth. Source: 75 Years Economic J... |
Electricity Consumption:
Pakistan's electricity consumption is an important indicator of economic activity and living standards. It has soared from 40 GWH in 1949 (1 KWH per capita) to 136,572 KWH in 2021 (620 KWH per capita). Last year, hydroelectric dams contributed 37,689 GWH of electricity or 27.6% of the total power generated, making hydropower the biggest contributor to power generated in the country. It was followed by coal (20%), LNG (19%) and nuclear (11.4%). Nuclear power plants generated 15,540 GWH of electricity in 2021, a jump of 66% over 2020. Overall, Pakistan's power plants produced 136,572 GWH of power in 2021, an increase of 10.6% over 2020, indicating robust economic recovery amid the COVID19 pandemic.
 |
|
|
 |
| Installed Power Generation Capacity Growth. Source: Bilal Gilani of... |
Population Growth:
Pakistan's population has grown rapidly over the last 75 years. It is now 227 million, 6.7 times 34 million in 1951. However, the total fertility rate has declined from 6.5 babies in 1950 to 3.3 babies per woman in 2021.
 |
|
|
 |
| Pakistan Total Fertility Rate Per Woman of Child-Bearing Age. Sourc... |
 |
|
|
 |
|
|
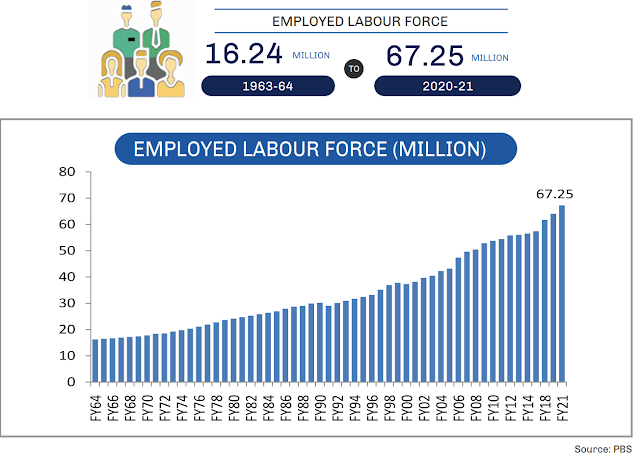
Unlike Pakistan's, India's labor participation rate (LPR) has been falling significantly in the last decade. It fell to 39.5% in March 2022, as reported by the Center for Monitoring Indian Economy (CMIE). It dropped below the 39.9% participation rate recorded in February. It is also lower than during the second wave of Covid-19 in April-June 2021. The lowest the labor participation rate had fallen to in the second wave was in June 2021 when it fell to 39.6%. The average LPR during April-June 2021 was 40%. March 2022, with no Covid-19 wave and with much lesser restrictions on mobility, has reported a worse LPR of 39.5%.
 |
| Labor Participation Rates in India and Pakistan. Source: ILO/World ... |
Youth unemployment for ages 15-24 in India is 24.9%, the highest in the South Asia region. It is 14.8% in Bangladesh and 9.2% in Pakistan, according to the International Labor Organization and the World Bank.
Pakistan has managed to significantly reduce poverty since its inception.
 |
|
|
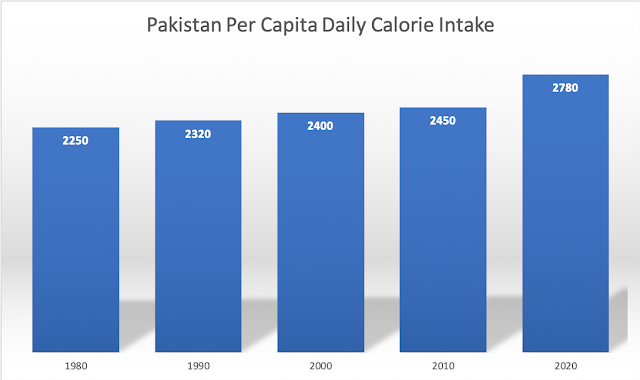
In terms of the impact of economic growth on average Pakistanis, the per capita average daily calorie intake jumped to 2,735 calories in FY 2021-22 from 2,457 calories in 2019-20. It has grown from 2250 calories in 1980 to 2780 calories in 2020.
 |
|
|
Agriculture:
Pakistan is among the world's largest food producers. It experienced broad-based economic growth across all key sectors in FY 21-22; manufacturing posted 9.8% growth, services 6.2% and agriculture 4.4%. The 4.4% growth in agriculture is particularly welcome; it helps reduce rural poverty.
 |
| Production of Tractors in Pakistan |
 |
| Wheat Production in Pakistan |
 |
| Rice Production in Pakistan |
 |
| Corn Production in Pakistan |
 |
| Sugarcane Production in Pakistan |
 |
| Meat Production in Pakistan |
 |
| Milk Production in Pakistan |
 |
| Cotton Production in Pakistan |
Literacy in Pakistan has increased from just 16.4% in 1950-51 to 62.8% in 2020-21. Male literacy is now at 73.4% but the female literacy lags at only 51.9%. The area of female literacy clearly requires greater attention and focus.
 |
| Literacy Rate in Pakistan |
 |
| University Enrollment in Pakistan |
 |
| Enrollment in Degree Colleges in Pakistan |
Telecommunications:
Telecommunication services and broadband subscriptions in Pakistan have rapidly grown, especially over the last two decades. The number of telephone and mobile users has increased from just 15,200 in 1947 to 194.2 million in 2021.
 |
| Phone Users in Pakistan |
Transportation:
Expansion of road infrastructure and increasing vehicle ownership have contributed to the growth of the road transport sector. Number of registered vehicles in Pakistan has soared from 31,892 in 1947 to 32.4 million in 2021. Road length has grown from 26,300 Km in 1947 to 500,000 Km in 2021.
| Vehicle Ownership and Road Length in Pakistan |
Pakistan has seen significant improvements in its population's living standards since independence in 1947. Average Pakistani has much higher income and greater access to food, healthcare, education, housing, transport, electricity and communication services.
Acknowledgement: Charts and data in this blog post are sourced from 75 Years Economic Journey of Pakistan published by Pakistan's Ministry of Finance.
South Asia Investor Review
Pakistan's Expected Demographic Dividend
Pakistan's Social Sector
World Bank: Pakistan Reduced Poverty, Grew Economy During Covid19 P...
Pakistan Among World's Largest Food Producers
Pakistan's Balance of Payments Crisis
Panama Leaks in Pakistan
Olive Revolution in Pakistan"
Naya Pakistan Sehat Card: A Giant Step Toward Universal Healthcare
Prime Minister Imran Khan's Effectiveness as Crisis Leader
India in Crisis: Unemployment and Hunger Persists After Waves of Covid
Riaz Haq's Youtube Channel
Views: 1136
-
Comment by Riaz Haq on October 4, 2022 at 6:22pm
-
Installed capacity for power generation in Pakistan: Tweet by Bilal I Gilani on Twitter (Graph shows installed power generation capacity from almost zero in 1947 to over 40,000 MW in 2021)
Tweet
See new Tweets
Conversation
Bilal I Gilani
@bilalgilani
انکے لیے کو کہتے ہیں پاکستان میں کوئی ترقی نہیں ہوئیبجلی کی پیداوار 1947 سے اب تک
Translate Tweet
https://twitter.com/bilalgilani/status/1577191450349277184?s=20&...
-
-
In the 2022 Global Hunger Index, Pakistan ranks 99th out of the 121 countries with sufficient data to calculate 2022 GHI scores. With a score of 26.1, Pakistan has a level of hunger that is serious.
https://www.globalhungerindex.org/pakistan.html
In the 2022 Global Hunger Index, India ranks 107th out of the 121 countries with sufficient data to calculate 2022 GHI scores. With a score of 29.1, India has a level of hunger that is serious.
https://www.globalhungerindex.org/india.html
-------------------
India also ranks below Sri Lanka (64), Nepal (81), Bangladesh (84), and Pakistan (99). Afghanistan (109) is the only country in South Asia that performs worse than India on the index.
https://www.thehindu.com/news/national/india-ranks-107-out-of-121-c...
India ranks 107th among 121 countries on the Global Hunger Index, in which it fares worse than all countries in South Asia barring war-torn Afghanistan.
The Global Hunger Index (GHI) is a tool for comprehensively measuring and tracking hunger at global, regional, and national levels. GHI scores are based on the values of four component indicators — undernourishment, child stunting, child wasting and child mortality. Countries are divided into five categories of hunger on the basis of their score, which are ‘low’, ‘moderate’, ‘serious’, ‘alarming’ and ‘extremely alarming’.
Based on the values of the four indicators, a GHI score is calculated on a 100-point scale reflecting the severity of hunger, where zero is the best score (no hunger) and 100 is the worst.
India’s score of 29.1 places it in the ‘serious’ category. India also ranks below Sri Lanka (64), Nepal (81), Bangladesh (84), and Pakistan (99). Afghanistan (109) is the only country in South Asia that performs worse than India on the index.
Seventeen countries, including China, are collectively ranked between 1 and 17 for having a score of less than five.
India’s child wasting rate (low weight for height), at 19.3%, is worse than the levels recorded in 2014 (15.1%) and even 2000 (17.15), and is the highest for any country in the world and drives up the region’s average owing to India’s large population.
Prevalence of undernourishment, which is a measure of the proportion of the population facing chronic deficiency of dietary energy intake, has also risen in the country from 14.6% in 2018-2020 to 16.3% in 2019-2021. This translates into 224.3 million people in India considered undernourished.
But India has shown improvement in child stunting, which has declined from 38.7% to 35.5% between 2014 and 2022, as well as child mortality which has also dropped from 4.6% to 3.3% in the same comparative period. On the whole, India has shown a slight worsening with its GHI score increasing from 28.2 in 2014 to 29.1 in 2022. Though the GHI is an annual report, the rankings are not comparable across different years. The GHI score for 2022 can only be compared with scores for 2000, 2007 and 2014..
Globally, progress against hunger has largely stagnated in recent years. The 2022 GHI score for the world is considered “moderate”, but at 18.2 in 2022 is only a slight improvement from 19.1 in 2014. This is due to overlapping crises such as conflict, climate change, the economic fallout of the COVID-19 pandemic as well as the Ukraine war, which has increased global food, fuel and fertiliser prices and is expected to "worsen hunger in 2023 and beyond."
The prevalence of undernourishment, one of the four indicators, shows that the share of people who lack regular access to sufficient calories is increasing and that 828 million people were undernourished globally in 2021.
There are 44 countries that currently have “serious” or “alarming” hunger levels and “without a major shift, neither the world as a whole nor approximately 46 countries are projected to achieve even low hunger as measured by the GHI by 2030,” notes the report.
-
-
The title of the UNDP paper on Multi-dimensional poverty 2022 (MPI) is "Unpacking Deprivation Bundle". Below is an excerpt from it:
"The analysis first looks at the most common deprivation profiles across 111 developing countries (figure 1). The most common profile, affecting 3.9 percent of poor people, includes deprivations in exactly four indicators: nutrition, cooking fuel, sanitation and housing.7 More than 45.5 million poor people are deprived in only these four indicators.8 Of those people, 34.4 million live in India, 2.1 million in Bangladesh and 1.9 million in Pakistan—making this a predominantly South Asian profile "
https://hdr.undp.org/system/files/documents/hdp-document/2022mpirep...
Also note in this UNDP report that the income poverty (people living on $1.90 or less per day) in Pakistan is 3.6% while it is 22.5% in India and 14.3% in Bangladesh.
-
-
Pakistan Demographic Survey 2020
https://www.dawn.com/news/1721179
The latest figures showed that although the overall life expectancy has dropped, it rose among men from 64.3 to 64.5. For women, it fell from 66.5 to 65.5 but was still higher than for men.
Life expectancy also increased for the 1-4 age group to 71.3, including 70.6 for males and 72 for females.
The infant mortality rate has fallen to 56 deaths per 1,000 live births. It was 60 in PSLM 2018-19, and 62 in PDHS 2017-18.
While the general fertility rate was 124, the age-specific data shows the rate was highest in the 25-29 age group at 215, followed by 176 in the 20-24 age group, 164 in the 30-34 age group, and 94 in the 35-39 age group.
This last age group (35-39) also saw the most significant jump when compared with the PDHS figure of 79.
The general fertility rate was also quite higher in rural areas (138) compared to urban areas (102).
The PDS shows that the country’s population has reached from 207.6m in 2017 to 220.42m now, including 111.69m men and 108.73m women. Most people continue to live in rural areas (139.41m) compared to urban areas (81m).
https://www.pbs.gov.pk/sites/default/files/population/publications/...
-
-
Pakistan Demographic Survey 2020
https://www.pbs.gov.pk/sites/default/files/population/publications/...
Total Fertility Rate (TFR)
Total Fertility Rate (TFR) is the summary measures of current fertility level. It indicates the number of
children to be born to a woman during her reproductive span of life, if she were to pass through all her
childbearing years conforming to the age-specific fertility rates of a given year. The advantage of this
measure is that it is less influenced by the age structure of the population. TFR is the most useful
indicator of fertility because it gives the best pictures of how many children women are currently
having. The TFR depicted by the PDS 2020, PDHS 2017-18 and PSLM- 2018-19 is given in Table No.
3.2. TFR in urban areas is lower than that in rural areas in all surveys.
---------
Life Expectancy
The Life Expectancy at birth is a summary measure Index that is obtained from a life table. It shows the
average number of years that persons can expect to live from the time of birth if they experience
currently prevailing age specific death rates throughout their life. The expectation of life at birth is
independent of the age structure of a population and therefore provides a more reliable index for
international comparisons of the level of mortality and social and economic condition of a country. The
Life Table of PDS-2020 for the year 2020 depicts that the expectancy of life at birth in Pakistan is 65
years; it is 64.5 for males and 65.5 for females. The life expectancy increases for age 1-4 both for males
and females i.e., 70.6 and 72 respectively and 71.3 overall.
------------------
Infant Mortality Rate has been declining in
Pakistan but it is still high. Infant Mortality Rates are much higher in rural areas 59 than in urban areas
50, where better Neo-Natal and Post-Natal facilities are available. Male Infant Mortality Rate is 58
which is higher than female Infant Mortality Rate 55 in all areas.
Table 3.8: Infant Mortality Rate PDHS 2017-18, PSLM-2018-19 and PDS-2020
Table 3.9: Infant Mortality Rate by Urban-Rural Residence and Sex PDS-2020
Neo-Natal and Post-Neo-Natal Mortality Rates
Mortality during the first year of life is divided into two main period’s i.e. Neo-natal Mortality
occurring within the first month and, Post-Neonatal Mortality occurring during the remaining 11
months. This distinction is useful as the causes as well as the levels of mortality are quite different in
these two periods. Table 3.10 shows that mortality within the first month after birth is very high in
2020. Like Crude Death Rates and Infant Mortality Rates, the PDS-2020 data indicates that the NeoNatal Mortality in rural areas is higher than in the urban areas.
Table 3.10: Neo-Natal and Post Neo-Natal Mortality Rates PDHS 2018-19 and PDS-2020
Area PDHS-2017-18 PSLM-2018-19 PDS-2020(2018-20)
Pakistan 62 60 56
-
-
Arif Habib Limited
@ArifHabibLtd
Power Generation DataPower Generation
Oct’22: 10,705 GWh (14,388 MW), -5% YoY | -17% MoM
4MFY23: 51,786 GWh (17,543 MW), -9% YoYFuel Cost
Oct’22: PKR 9.02/KWh, -3% YoY | -9% MoM
4MFY23: PKR 9.99/KWh, +41% YoYhttps://twitter.com/ArifHabibLtd/status/1593521259626737665?s=20&am...
-
-
Here’s Goldman Sachs' Take on World Economy Through 2075
Goldman Sachs analysts said slower population growth will present “a number of economic challenges,” such as how nations will pay for rising health costs of their aging populations.
https://www.law.com/dailybusinessreview/2022/12/06/heres-goldman-sa...
Goldman Sachs Group Inc. economists have taken a stab at predicting the path of the world economy through 2075.
Two decades since they famously outlined long-term growth projections for the so-called BRIC economies, the economists, now led by Jan Hatzius, expanded their projections to encompass 104 countries over the next half-century.
The results:
Global growth will average just under 3% a year over the next decade, down from 3.6% in the decade before the financial crisis, and will be on a gradually declining path afterwards, reflecting a slowing of labor force growth.
Emerging markets will continue to converge with industrial nations as China, the U.S., India, Indonesia and Germany top the league table of largest economies when measured in dollars. Nigeria, Pakistan and Egypt could also be among the biggest.
The U.S. is unlikely to repeat its relative strong performance of the last decade, and the dollar’s exceptional robustness will also unwind over the next 10 years.
While income inequality between countries has fallen, it will continue to rise within them.
Economists Kevin Daly and Tadas Gedminas saw protectionism and climate change as risks that are “particularly important” both for growth and the convergence of incomes.
------------
Pakistan projected to be among largest economies in the world by 2075: Goldman Sachs
https://www.dawn.com/news/1725141
A research paper published by Goldman Sachs on Tuesday projected Pakistan to be the sixth largest economy in the world by 2075 given “appropriate policies and institutions” are in place.
Authored by economists Kevin Daly and Tadas Gedminas and titled ‘The Path to 2075’, the paper projected that the five largest economies by 2075 will be China, India, the US, Indonesia and Nigeria.
Goldman Sachs has been projecting long-term growth of countries for almost two decades now, initially starting out with BRICs economies, but for the past 10 years they have expanded those projections to cover 70 emerging and developed economies.
Their latest paper covers 104 countries with projections going as far as 2075.
-
-
Pakistan projected to be among largest economies in the world by 2075: Goldman Sachs
https://www.dawn.com/news/1725141
Pakistan’s star future status is predicted on the back of its population growth, which along with Egypt and Nigeria, could place it among the largest economies in the world in the next 50 years, according to Goldman Sachs.
By that time, the research projects Pakistan’s Real GDP to have grown to $12.7 trillion and its GDP per capita to $27,100.
These numbers, however, are projected to be less than a third of the size of China, India and the US. India’s Real GDP in 2075 is projected at $52.5 trillion and per capita GDP at $31,300.
Among key risks to their projections, the economists particularly highlight “environmental catastrophe” and “populist nationalism”.
Unless a path to sustainable growth is ensured through a globally coordinated response, climate change could heavily skew these projections, particularly for countries like Pakistan, with geographies that are especially vulnerable.
With populist nationalists coming to power in many countries, the report says it might lead to increased protectionism that could potentially result in the reversal of globalisation, thereby increasing income inequality across countries.
Other key projections
Global growth on a declining path
The paper notes that global growth has slowed from an average of 3.6 per cent per year in the past 10 years to 3.2pc, and the slowdown has been relatively broad-based.
They project global growth will average 2.8pc between 2024 and 2029 and will be on a gradually declining path.
The rise of emerging markets
While global growth is dipping, emerging economies are growing faster than developed markets and will continue to converge with them.
“The weight of global GDP will shift (even) more towards Asia over the next 30 years nations as China, the US, India, Indonesia and Germany top the league table of largest economies when measured in dollars. Nigeria, Pakistan and Egypt could also be among the biggest.”
Declining global population
The decline in global growth will be driven by the decline in population growth, which UN projections imply will fall to close to zero by 2075. The paper says this is a “good problem to have” as it mitigates damages to the environment but could pose economic problems arising from high healthcare costs and an ageing population.
US won’t repeat exceptional growth
The US won’t be able to repeat its strong performance from the last decade, with potential growth remaining “significantly lower” than that of large developing economies.
The US dollar is also projected to lose strength in the next 10 years.
Less global inequality, more local inequality
Emerging markets’ convergence has led to falling income inequality between economies but income inequality within most economies has risen. This poses a major challenge to the future of globalisation.
-
-
In last 65 years (1952-2018), #Pakistan's #GDP growth rate has averaged 4.92%, reaching an all time high of 10.22% in 1954 & a record low of -1.80% in 1952. If Pakistan continues to average 4.92% over the next 53 years until 2075, it will be $4.9 trillion GDP in today's dollars
https://twitter.com/haqsmusings/status/1600882957543043072?s=20&...
-
-
In last 65 years (1952-2018), #Pakistan's #GDP growth rate has averaged 4.92%, reaching an all time high of 10.22% in 1954 & a record low of -1.80% in 1952. If Pakistan continues to average 4.92% over the next 53 years until 2075, it will be $4.9 trillion GDP in today's dollars
https://twitter.com/haqsmusings/status/1600882957543043072?s=20&...
$1 in 2021 is equivalent in purchasing power to about $5.27 in 2075, an increase of $4.27 over 54 years. The dollar had an average inflation rate of 3.13% per year between 2021 and 2075, producing a cumulative price increase of 426.85%. The buying power of $1 in 2021 is predicted to be equivalent to $5.27 in 2075.
https://www.in2013dollars.com/us/inflation/2021?endYear=2075&am...
----------------------
Multiplying $4.9 trillion in today's dollars by 5.27 gives us $25.8 trillion in 2075 dollars.
Twitter Feed
Live Traffic Feed
Sponsored Links
South Asia Investor Review
Investor Information Blog
Haq's Musings
Riaz Haq's Current Affairs Blog
Please Bookmark This Page!
Blog Posts
Growing Fan Base of Cockroach Janata Party in India
"Indians live like cockroaches and die like cockroaches", argued Jayant Bhandari in an X post in April this year. "They vote for bottom of the barrel cockroaches as rulers, who rightly treat them as cockroaches", he added, faulting the people of India for this state of affairs. More recently, Indian Supreme Court Chief Justice Surya Kant said during a hearing that certain unemployed youth were "like cockroaches" who enter professions with fake degrees or become social media…
ContinuePosted by Riaz Haq on June 2, 2026 at 1:30pm — 3 Comments
Iron Brothers China and Pakistan Celebrate 75 Years of "Unbreakable" Friendship
President Xi Jinping and Prime Minister Shehbaz Sharif have met today in Beijing to reaffirm the "unbreakable" bond between their two "iron brother" countries on the 75th anniversary of the establishment of the China-Pakistan diplomatic ties. "No matter how the international landscape may evolve, China will always place priority on the development of China-Pakistan relations in its diplomacy with neighboring countries," he said. Over 7 decades of friendship witnessed Pakistan help…
ContinuePosted by Riaz Haq on May 25, 2026 at 8:30pm — 7 Comments
© 2026 Created by Riaz Haq.
Powered by
![]()
You need to be a member of PakAlumni Worldwide: The Global Social Network to add comments!
Join PakAlumni Worldwide: The Global Social Network