PakAlumni Worldwide: The Global Social Network
The Global Social Network
Pakistan Second Lowest Cost Country With $877 Billion PPP GDP and $4,450 Per Capita GDP
World Bank's International Comparison Program (ICP) does a detailed study of a list of around 800 household and nonhousehold products to compare real purchasing power for trans-national income comparison program (ICP). The latest ICP findings conclude that Pakistan's per capita income is US$4,450.00, just slightly below India's US$4,735.00
 |
| ICP Based GDP Per Capita. Source: World Bank |
At US$4,450 per capita, Pakistan's PPP GDP works out to US$788 billion for 2011, and more than a trillion US dollars now.
The results of an earlier ICP program for 2005 and 2006 released by Asian Development Bank in 2009 concluded that Pakistan's per capita income was HK$ 13,528. It reported India’s per capita as HK $12,090.
 |
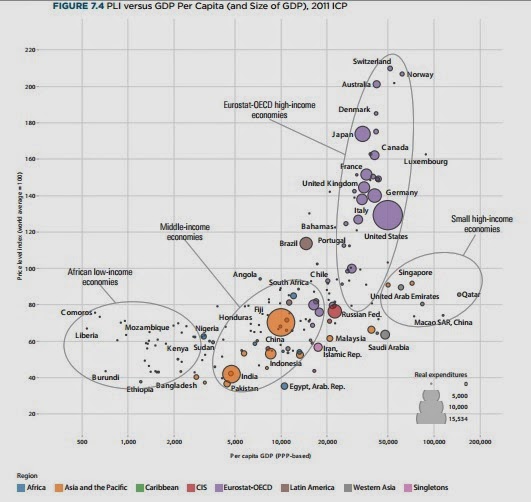
| Price Level Index Rankings. Source: World Bank |
The ICP program uses Price Level Index (PLI) as an indicator of cost of living in a country. It defines PLI as the ratio of a PPP (purchasing power parity) to a corresponding exchange rate. An index over 100 means prices are higher on average than in the world, and one less than 100 means prices are relatively lower. Pakistan's PLI of 28.2 ranks it at 176, just above the last-ranked Egypt's PLI of 27.2 at 177. India's PLI of 32.4 ranks it at 127.
23 economies are showing a PLI of 50 or below. The cheapest economies are Egypt, Pakistan, Myanmar, Ethiopia and Lao People's Democratic Republic, with indices ranging from 35 to 40.
The most expensive economies in GDP terms are Switzerland, Norway, Bermuda, Australia and Denmark, with indices ranging from 210 to 185. The United States ranked 25th in the world, lower than most other high-income economies, including France, Germany, Japan, and the United Kingdom.
Here are some of the other major findings of World Bank ICP 2011:
1. The six largest middle income economies – China, India, Russia, Brazil, Indonesia and Mexico – account for 32.3 percent of world GDP, whereas the 6 largest high income economies – United States, Japan, Germany, France, United Kingdom, and Italy – account for 32.9 percent.
2. Asia and the Pacific, including China and India, accounts for 30 percent of world GDP, Eurostat-OECD 54 percent, Latin America 5.5 percent (excluding Mexico, which participates in the OECD and Argentina, which did not participate in the ICP 2011), Africa and Western Asia about 4.5 percent each.
3. China and India make up two-thirds of the Asia and the Pacific economy, excluding Japan and South Korea, which are part of the OECD comparison.
4. Russia accounts for more than 70 percent of the CIS, and Brazil for 56 percent of Latin America.
5. South Africa, Egypt, and Nigeria account for about half of the African economy.
Last week, another survey done by Cato Institute found that Pakistan fares better than its neighbors on world misery index. Back in 1960s, distinguished American economist Arthur Okun defined misery index as sum of inflation and unemployment rates. America's high misery index was cited by candidate Jimmy Carter as a reason to elect him president in his 1976 presidential race against President Gerald R. Ford. The Cato Institute has now revived it by adding interest rates to the sum of inflation and unemployment rates and subtracting per capita GDP growth rate from it.
Pakistan (score 21.9) at 28 ranks below Iran (score 61.6) at 2 and India (score 25.6) at 19 on world misery index rankings for 2013 compiled by Washington's Cato Institute. Other nations worse off than Pakistan on the list include Serbia, Argentina, Jamaica, Egypt, Spain, South Africa, Brazil, Greece, Macedonia, Palestine, Turkey, Cyprus, Croatia, Dominican Republic, Georgia, Nicaragua, Honduras, Costa Rica, Jordan, Ukraine, Peru, Uruguay, Portugal and Barbados. Indonesia (score 21.6) at 29 is only slightly better off than Pakistan.
Earlier this year, Economist Intelligence Unit's latest Worldwide Cost of Living survey revealed that Pakistan’s Karachi is the second cheapest city of the world in 2014 while India’s Mumbai is the cheapest. The top 10 cheapest cities include Mumbai, Karachi, New Delhi, Kathmandu, Damascus, Algiers, Bucharest, Panama City, Jeddah and Riyadh in that order, according to EIU.
Related Links:
Haq's Musings
Pakistan's Per Capita Income
Pakistan Fares Better Than Neighbors on World Misery Index
Pakistan's Underground Economy
India Pakistan Comparison
Pakistan Economic History\
Pakistan's Expected Demographic Dividend
Views: 546
-
Comment by Riaz Haq on May 14, 2014 at 4:49pm
-
Pakistan is the 23rd largest economy in the world as of 2011, according to the World Bank's International Comparison Program (ICP) 2011:
1. United States $15,534 billion
2. China $13,495 billion
3. India $5,757 billion
4. Japan $4,380 billion
5. Russia $3,216 billion
6. Germany $3,352 billion
7. Brazil $2,816 billion
8. France $2,369 billion
9. United Kingdom $2,201 billion
10. Indonesia $2,058 billion
11. Italy $2,056 billion
12. Mexico $1,895 billion
13. Spain $1,483 billion
14. South Korea $1,445
15. Canada $1,416 billion
16. Saudi Arabia $1,367 billion
17. Iran $1,315 billion
17. Turkey $1,315 billion
18. Australia $956 billion
19. Taiwan $907 billion
20. Thailand $899 billion
21. Egypt $843 billion
22. Poland $838 billion
23. Pakistan $788 billion
24. Netherlands $720 billion
25. Malysia $606 billion
Source: Purchasing Power Parities and Real Expenditures of World Economies
Summary of Results and Findings of the
2011 International Comparison ProgramSiteresources.worldbank.org/ICPINT/Resources/270056-1183395201801/Summary-of-Results-and-Findings-of-the-2011-International-Comparison-Program.pdf
-
-
World Bank now says Pakistan's poor population living on less than $1.25 a day is down from 35 million to 5 million, one-seventh of the earlier estimates. Here's World Bank's Center for Global Dev (CDG) report on major downward revision in world poverty figures based on ICP 2011 PPP GDP estimates:
What lies behind the dramatic changes in calculated GDP and poverty rates? A big factor may be that the national inflation rates used to convert incomes into 2005 PPP dollars in the last few years appear to be higher than the rate of inflation reflected in the baskets of goods and services measured by the two rounds of ICP surveys: Pakistan’s PPP conversion rate for GDP was 19.1 Rupees to the dollar in 2005 and 24.4 in 2011 — a gentle increase of 28 percent. The Consumer Price Index in Pakistan has gone up 102 percent over that same period. That might reflect changing or inadequate ICP commodity baskets or consumption data in one or both years, or mismeasurement of prices by Pakistan’s statistical agencies. But whatever the reason, it appears to apply to a lot of countries. Very few places saw PPP conversion rates climb close to or more than CPIs between 2005 and 2011, which is why poverty rates based on the 2011 PPP numbers tend to be lower.
----------
CORRECTIONS AND UPDATE: In checking our methodology (prompted by Laurence Chandy, to whom thanks), we realize that we underestimated the impact of the new PPP lines on poverty due to two mistakes in the computer code underlying the original version of this post: we used 2010 CPI figures where we meant to use 2011, and conversely, we used 2011 population figures where we meant to use 2010. An explanation of the error and the changed numbers are presented below, along with access to the original estimates and all code. We’ve used strikethrough and square brackets in the text to show where language and numbers have changed, the pictures refer to the corrected data. We’ve also taken the opportunity to add some final thoughts on the discussion in an update below.On Tuesday night, the International Comparison Project released the latest purchasing power parity numbers for the world’s economies. The vast majority of the planet slept right on as if nothing had happened.* And they were right. But the new numbers still suggest the size and distribution of world income looks considerably different than we previously thought. The World Bank will produce new official estimates in the coming days, but our preliminary estimates suggest the share of people in the developing world living below the absolute poverty line of $1.25 per day in 2010 “fell” by nearly half, from about 19.7 percent to 11.2 8.9, thanks to the revisions.
---------
The estimated number of $1.25 poor in India in 2010 falls from 396 393 million to 148 102 million, thanks to the revisions. The number of poor people in Nigeria goes from 88 87 to 60 51 million. And pretty much every country is sloping downward — using the same national survey data the new ICP numbers suggest much lower rates of absolute poverty.
-----------
DETAILS OF CORRECTION: In the original version of this blog we presented numbers that missed out a year of CPI data (2011) in the calculation of the adjustments caused by the update. This error led to numbers that underestimated the potential impact of the revisions on the 2005 $1.25 PPP poverty. We also used 2011 population numbers rather than 2010 numbers. These errors were pointed out by Laurence Chandy of Brookings (who has his own post on the new PPPs and poverty), and we are very grateful to him. It is a sign of how many poor people are bunched near the 2005 $1.25 PPP line that missing one year of CPI data can have such a dramatic impact on the numbers...http://www.cgdev.org/blog/global-absolute-poverty-fell-almost-half-...
Comment
Twitter Feed
Live Traffic Feed
Sponsored Links
South Asia Investor Review
Investor Information Blog
Haq's Musings
Riaz Haq's Current Affairs Blog
Please Bookmark This Page!
Blog Posts
Is Rapid Electrification Stimulating Pakistan's Economy?
Pakistan's electricity demand has soared 21% in just two years. Rapid electrification is positively impacting all sectors of Pakistan's economy. thanks to growing deployment of distributed solar, estimated at 38 GW as of June, 2025. In 2025, 44% of solar deployment was residential, followed by industry (26%), agriculture (21%) and commercial users (9%). It is stimulating demand for a variety of products ranging from air conditioners and refrigerators to washing machines and…
ContinuePakistan Needs to Address Its Significant Data Quality Challenges
Policy-makers need data to formulate good policies. Good data produced by government agencies can be expected to lead to good policies and desirable outcomes. But data collection and statistical analyses require adequate methodologies and resources. Unfortunately, Pakistan's data quality gets a "C" grade by international agencies like the International Monetary Fund (IMF). Clearly the country faces significant data quality challenges. These challenges range from estimation of the size…
ContinuePosted by Riaz Haq on July 7, 2026 at 9:30am — 8 Comments
© 2026 Created by Riaz Haq.
Powered by
![]()
You need to be a member of PakAlumni Worldwide: The Global Social Network to add comments!
Join PakAlumni Worldwide: The Global Social Network