PakAlumni Worldwide: The Global Social Network
The Global Social Network
Animal Droppings Boost India's GDP
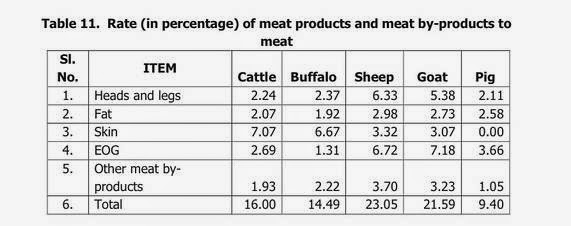
"The estimated “evacuation (defecation) rates” are 0.3 kilograms per day for goats and 0.8 kilograms per day for sheep. The study, titled “Positive Environmental Externalities of Livestock in Mixed Farming Systems of India,” was conducted jointly by the Central Institute for Research on Goats, in Makhdoom, Uttar Pradesh, and the National Center for Agricultural Economics and Policy Research in New Delhi. With all those “droplets” added in, the value of India’s livestock sector in the new GDP series is 9.1 billion rupees, or $150 million, higher than it was in the old series." Wall Street Journal on India's GDP Revisions
Animal droppings (BS) is just one of many innovations of Central Statistical Office (CSO) that are being used to support India's claim to be growing faster than China. Until early February, when CSO changed the way it measures economic activity, India was enduring its weakest run of growth since the mid-1980s. Now it is outpacing China, having grown an annual 7.5% in the fourth quarter of last year, reports Business Standard.
|
Indian Livestock GDP Calculations. EOG=Edible Offals, Glands. Sourc... |
While India's boosters in the West are not only buying but applauding the new figures, Indian policy professionals at the nation's Central Bank and the Finance ministry are having a very hard time believing the new and improved GDP brought to the world by Indian government. Dissenters include Morgan Stanley's Ruchir Sharma, an Indian-American, who has called the new numbers a "bad joke" aimed at a "wholesale rewriting of history".
Based on the latest methodology, it is claimed that the Indian economy expanded 7.5 percent year-on-year during the last quarter, higher than 7.3 percent growth recorded by China in the latest quarter, making it the fastest growing major economy in the world, according to Reuters. Is it wishful thinking to make Indian economy look better than China's?
|
The GDP revisions have surprised most of the nation's economists and raised serious questions about the credibility of government figures released after rebasing the GDP calculations to year 2011-12 from 2004-5. So what is wrong with these figures? Let's try and answer the following questions:
1. How is it possible that the accelerated GDP growth in 2013-14 occurred while the Indian central bankers were significantly jacking up interest rates by several percentage points and cutting money supply in the Indian economy?
2. Why are the revisions at odds with other important indicators such as lower industrial production and trade and tax collection figures? For the previous fiscal year, the government’s index of industrial production showed manufacturing activity slowing by 0.8%. Exports in December shrank 3.8% in dollar terms from a year earlier.
3. How can growth accelerate amid financial constraints depressing investment in India? Indian companies are burdened with debt and banks are reluctant to lend.
4. Why has the total GDP for 2013-14 shrunk by about Rs. 100 billion in spite of upward revision in economic growth rate? Why is India's GDP at $1.8 trillion, well short of the oft-repeated $2 trillion mark?
Questions about the veracity of India's economic data are not new. US GAO study has found that India's official figures on IT exports to the United States have been exaggerated by as much as 20 times.
Similarly, French economist Thomas Piketty has argued in his best seller "Capital in the Twenty-First Century that the GDP growth rates of India and China are exaggerated. Picketty writes as follows:
"Note, too, that the very high official growth figures for developing countries (especially India and China) over the past few decades are based almost exclusively on production statistics. If one tries to measure income growth by using household survey data, it is often quite difficult to identify the reported rates of macroeconomic growth: Indian and Chinese incomes are certainly increasing rapidly, but not as rapidly as one would infer from official growth statistics. This paradox-sometimes referred to as the "black hole" of growth-is obviously problematic. It may be due to the overestimation of the growth of output (there are many bureaucratic incentives for doing so), or perhaps the underestimation of income growth (household have their own flaws)), or most likely both. In particular, the missing income may be explained by the possibility that a disproportionate share of the growth in output has gone to the most highly remunerated individuals, whose incomes are not always captured in the tax data." "In the case of India, it is possible to estimate (using tax return data) that the increase in the upper centile's share of national income explains between one-quarter and one-third of the "black hole" of growth between 1990 and 2000. "
T.C.A. Anant, the chief statistician of India, has told the Wall Street Journal that “there’s a large number of areas where we have deviated (from the United Nations’ latest guidebook on measuring GDP) for a large measure, because we are simply, at the moment, unable to implement those recommendations.”
Related Links:
Is India Fudging GDP to Look Better Than China?
India's IT Exports Highly Exaggerated
India-Pakistan Economic Comparison 2014
Pakistan's Official GDP Figures Ignore Fast Growing Sectors
Challenging Haqqani's Op Ed: "Pakistan's Elusive Quest For Parity"
State Bank Says Pakistan's Official GDP Under-estimated
Pakistan's Growing Middle Class
Pakistan's GDP Grossly Under-estimated; Shares Highly Undervalued
Fast Moving Consumer Goods Sector in Pakistan
Views: 707
-
Comment by Riaz Haq on April 17, 2015 at 9:39pm
-
Former central bank governor Dr Y V Reddy once quipped to me that while the future is always uncertain, in India even the past is uncertain, given how often the government revises economic data. Even by that standard, however, the dramatic upward revision of the GDP growth rate is a bad joke, smashing India’s credibility and making its statistics bureau a laughing stock in global financial circles.
The new and not-so-funny numbers show that the Indian economy grew at a pace of 6.9% in the last fiscal year, a claim that is fantastic in the extreme. Many Indian economists have set out to show that the new growth numbers for the economy as a whole simply don’t add up, as a sum of the parts. Every piece of data — from the tepid increase in corporate revenues to imports, credit, rail freight and auto sales — points to a much lower growth figure, probably closer to the old estimate of 5%.
Surprisingly, for a country obsessed with its GDP growth rate, there is not much outrage at this travesty, either in public or at cocktail parties. In the past, India’s habit of revising economic data was confined to relatively minor tweaks, but this latest update is a wholesale rewriting of history. In the international financial community, no one had questioned the veracity of India’s economic numbers, until now.
This makes India look bad even compared to China, which many analysts have long suspected of massaging GDP figures to show steady growth. But the same sceptical analysts admit that when China manipulates its numbers, it does so carefully and only when the actual growth rate falls below its official target, as it has of late. The authorities seem to know exactly what they are doing. India’s new GDP data clashes even with the pronouncements of some government and central bank officials, suggesting that the left arm doesn’t seem to know what the right arm is doing.
The whole episode is reinforcing the bad rap India gets for poor governance standards. To be sure, many emerging nations including Turkey and Nigeria have issued flattering upward revisions of their growth data in recent years, but generally without eliciting peals of laughter. Last year, Nigeria issued a revision showing that the economy was nearly twice as large as previously reported, but it was widely accepted because the new methodology was well explained and had the endorsement of the International Monetary Fund.
The IMF in fact recommends that, every five years, countries update the base year they use to calculate the pace of growth in the economy. The idea is to capture the impact of new growing industries, and Nigeria hadn’t updated its base year since 1990. India’s last revision came in 2010, so this one came on schedule. Only the statistics bureau clearly rushed it into print, without conducting even an elementary ‘smell test’ to ensure that the new numbers square with the reality on ground. One clear sign of the bureau’s haste to publish is the fact that it released revised data for only the last two years, making it impossible to see the long-term trend for India’s growth rate.
Nobody really believes that the Indian economy grew at anywhere close to 7% last year, and shockingly no one is willing to put an end to this nonsense. When India delivers its budget on February 28, officials are likely to claim that economic growth in the coming year will accelerate to around 8% — a figure based on the new series. A forecast based on dodgy numbers will only cast doubt on India’s claim to be the world’s fastest-growing large emerging market, though that claim could easily prove true in a couple of years, based on credible numbers.http://blogs.timesofindia.indiatimes.com/toi-edit-page/6-9-growth-w...
-
-
On popular demand, I post a graph of the difference between the GDP data and the RBI Balance of Payments (BoP) data. This is referencing my posts on how the Q4 data has been ‘fudged’ and India is likely to have seen GDP contraction (in real terms, that is, accounting for inflation). Read: Has India Plunged Into Recession? GDP Data Fudge Reveals Details and India *HAS* Seen Negative GDP Growth, BoP Confirms Data Fudge

(Click for a larger picture)
As you can see the March 2012 quarter is very strange – Exports are larger in the MOSPI figure than the BoP figure tells us, and GDP imports are much smaller than BoP data.
But there’s an important takeaway.
Exports may have been understated in GDP figures in the first three quarters of this year, by about 65,000 cr. The discrepancy in Q4 is about 87,000 cr. So the difference, for the whole year, is a manageable 22,000 cr. You might be able to explain that by saying that they’ve stuffed the corrections into the last quarter. (I don’t believe that – they keep revising earlier quarter numbers with every GDP release – so if you update the past figures, you’re not allowed the excuse that you stuff corrections into the last quarter).
But Imports remain a mystery. Even if you account for stuffing (Imports have been overstated in the GDP in the Sep and Dec quarters) the difference for the full year, between the MOSPI GDP Data and the RBI BoP, is about 120,000 cr., which is a fairly large number to miss.
The difference in imports is so large that even if you rejig for past quarter misses, it will still result in much lower GDP growth. Reworking the numbers for a (-120,000 cr.) net export figure – negative because we imported more than we exported – we still get a nominal growth number of about 4.5%. Subtracting inflation of 7% and, like we’ve talked about, a GDP contraction. Even if we eke out positive growth for the year, It’s not looking good for the last quarter.
I’ve also been told that I’m being silly for believing any of the numbers in the GDP releases, since they are largely figments of people’s imagination. While I hope that is not true, it’s not a theory that can be written off, so please use appropriate pinches of salt.
http://capitalmind.in/2012/07/gdp-data-fudge-vs-bop-recent-differen...

-
-
MUMBAI—A large pile of debt on the books of India’s big infrastructure companies is complicating Prime Minister Narendra Modi’s plans to boost the country’s economy and improve its woeful roads, electric grids and other public works.
The companies that build big projects owe more than 3 trillion rupees ($48 billion), the result of a failed effort by the previous government to get businesses to help improve India’s infrastructure. The total amount of debt for Indian infrastructure companies is at its highest in more than a decade, affecting the overall economy because banks, fearing the loans won't be repaid, are reluctant to lend to other companies.
Debt levels have risen across Asia in the past five years and are now higher than they were before the Asian financial crisis in 1997. The borrowing has taken different forms in different countries. In China, giant state-owned companies borrowed the most, in Thailand and Malaysia, consumers took on debt, while in Japan, the government boosted its world-leading borrowing.
High debt levels could limit India’s ability to help drive global growth at a time when China is slowing and many of the world’s economies are weak. Foreign portfolio investors have poured $42 billion into Indian stocks and bonds over the past year, leaving them vulnerable to cracks in the country’s economy.
In India, overall debt levels are relatively low. But the sector struggling the most with its borrowing is also one that Mr. Modi is counting on to juice the economy and boost the country’s productivity. Instead, the companies are now focused on reducing their debt.
“At this point, we are not able to commit more equity to new projects,” said Ankineedu Maganti, managing director of Soma Enterprise Ltd., a south India-based developer of roads and other infrastructure projects. “We’re still trying to recover from the past.”
--------------
In 2014, bank credit to infrastructure was 14% of overall credit, and now infrastructure companies account for among the biggest portions of the bad and stressed loans on the books of Indian banks.
The bad debt has made banks less willing to lend, weighing on the overall economy, according to a Finance Ministry report in December. “The ripples from the corporate sector have extended to the banking sector where restructured assets are estimated at about 11-12% of total assets,” the report said. “Displaying risk aversion, the banking sector is increasingly unable and unwilling to lend.”
Banks have been pushing infrastructure companies to sell assets and pay back debt. But India’s insolvency laws make it unattractive for lenders to push companies into liquidation, so the standoff is likely to continue.
http://www.wsj.com/articles/indias-debt-pile-up-complicates-growth-...
-
-
#India Worst performing stock market? This is the end of the Modi bubble for FIIs
Is PM Narendra Modi running out of luck? He had famously boasted being a lucky Prime Minister while seeking votes during the Delhi elections. The context, of course, was international oil prices had less than halved and that seemed to have brought all round uptick in economic sentiment, what with the stock markets soaring to new highs early 2015. Consensus among global FIIs was that they will remain overweight India as compared to other markets like China, Brazil, South Korea, Taiwan and Russia. But everything seems to be reversing over the past month and a half.
Suddenly the FIIs, with a cumulative investment in Indian stocks of about $300 billion at market value, are looking at other emerging stock markets for returns and no longer treat India as the most preferred destination as they did last year, and even the beginning of this year. FII net outflows gave been of the order of Rs 12,500 crore over the past month. The stock market index has seen the biggest correction of 10 percent in a short time. This has caused speculation whether the markets are slipping into a bear phase.
But what is indeed worrisome is India is probably the worst performing stock market among emerging economies this year. This is in sharp contrast to the view taken by the big FIIs that the Modi government reforms could trigger a multi-year bull run in India. Now the same FIIs are shifting the weightage of their global allocation to China where the stock markets have shown 30 percent growth since January. India's Sensex growth remains in negative territory. Even FII inflows, which primarily influence market movement, are flat to negative since January.
Worse, now FIIs also seem to prefer oil exporting markets like Russia and Brazil, both of whom had fallen out of favour after the global oil prices had more than halved, badly affecting their revenues. Now the FIIs believe that oil prices are moderately correcting and returning to oil exporting markets like Russia and Brazil makes sense. This view is buttressed by another major consideration. They feel as the US economy recovers and the prospect of monetary tightening by the Federal Reserve brightens, the dollar would strengthen in the short to medium term.
The Economic Times has just reported a survey of top CEOs and the majority of them suggest that demand is depressed. "The bonhomie and cheer that greeted the arrival of the Modi government is replaced by a sombre mood and a grim acknowledgement of the realities of doing business in India," reports ET, as it captures the sentiment of the CEOs. Little wonder that this is reflecting in the behaviour of the stock market and currency. The largest engineering conglomerate L&T had said some of its plants are lying idle as demand for capital goods is very weak. The Aditya Birla Group had deferred its revenue target of $65 billion by 3 years, to 2018.
These are not good signs for the economy and both the stock market and currency will reflect this in the months ahead.
http://www.firstpost.com/business/worst-performing-stock-market-end...
-
-
Summary
- Months after the release of the new GDP methodology with much higher numbers, it still remains wildly inconsistent with numerous other indicators, pointing to continued economic slack.
- The revised GDP numbers particularly pose dangers for monetary policy decisions, as much of India expects the RBI to cut rates.
- RBI Governor Raghuram Rajan and the government’s Chief Economic Adviser Arvind Subramanian, two trained economists, remain 'puzzled' with the new numbers.
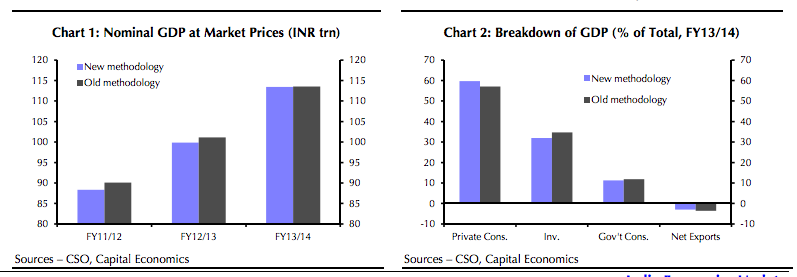
Part I of this article series looked at the change in the methodology of calculating India's GDP that literally overnight transformed an 'ailing' economy into one of the best performing economies globally. The problem is not with the methodology per se. The methodology is the same that is globally accepted; the problem is with the missing comparable numbers as per the older methodology, and the missing longer term historical data for the new one (not necessary that historical data beyond three years be made public, but it should at least be made available to statisticians doing the exercise and to other approved authorities for scrutiny/confidence building).
Most importantly, going by what ultimately matters beyond the academic or statistical exercises - that is the on-ground realities of seeing firsthand the differences between a 5% economic growth story and a close to 8% growth a few years back - one does not sense any significant change in real economy from that of an ailing one. India is a nation endowed with a demographic dividend and a billion plus population with a per capita income significantly lower than $2,000 (nominal), where one can literally sense relatively high and improving GDP growth rates if it has been there for last three years, as the case is now 'made' out to be. But these new GDP numbers fail to achieve any of it.
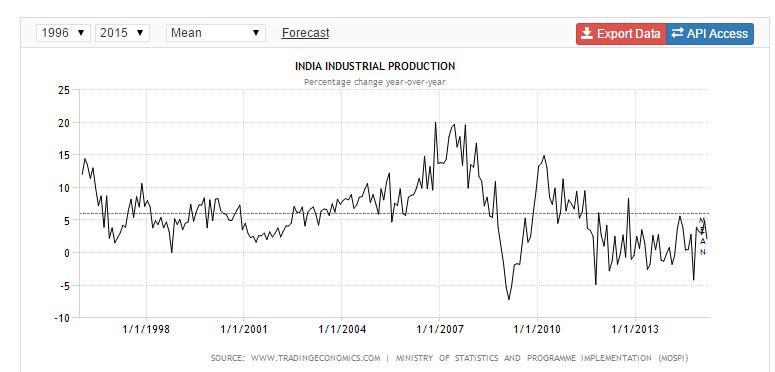
Presented here are some of the related data over the years to get a comprehensive picture. The Index of Industrial Production (IIP) data reveal two insights: Post 2008, there may have not been a sustainable recovery but a sharp bounce back in 2011 which can be attributed to a typical inventory bounce back as normally seen after a period of sharp decline like the one during the 2008-09 period. In a slowdown, cut back in production is multiplied by the effect of sharp inventory reductions, making the situation even worse. An inventory bounce back is the opposite of it. With signs of recovery, companies start filling up shelves again faster than the real demand. The Economist blog, referred in Part I, first suggested that based on the IMF's World Economic Data following market prices, India grew faster than China in the April-March 2010-11 financial year of India's vis-à-vis China's calendar year of 2010. This observation synchronizes well with the inventory bounce back of IIP numbers observed in the following IIP chart.
The IIP for March, reported on 12th May, came in at a five-month low of 2.1%, making the yearly average for 2014-15 at 2.8% compared to a contraction of 0.1% for 2013-14.
(click to enlarge)
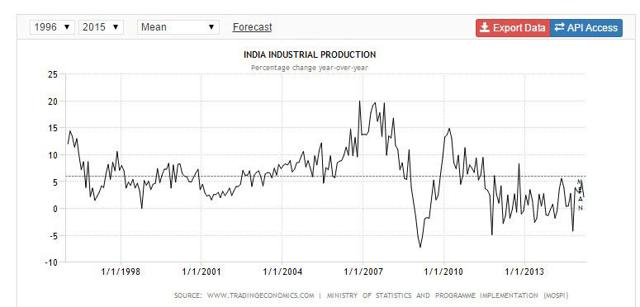
Source: Trading Economics (Data Ministry of Statistics and Programme Implementation, Govt. of India)
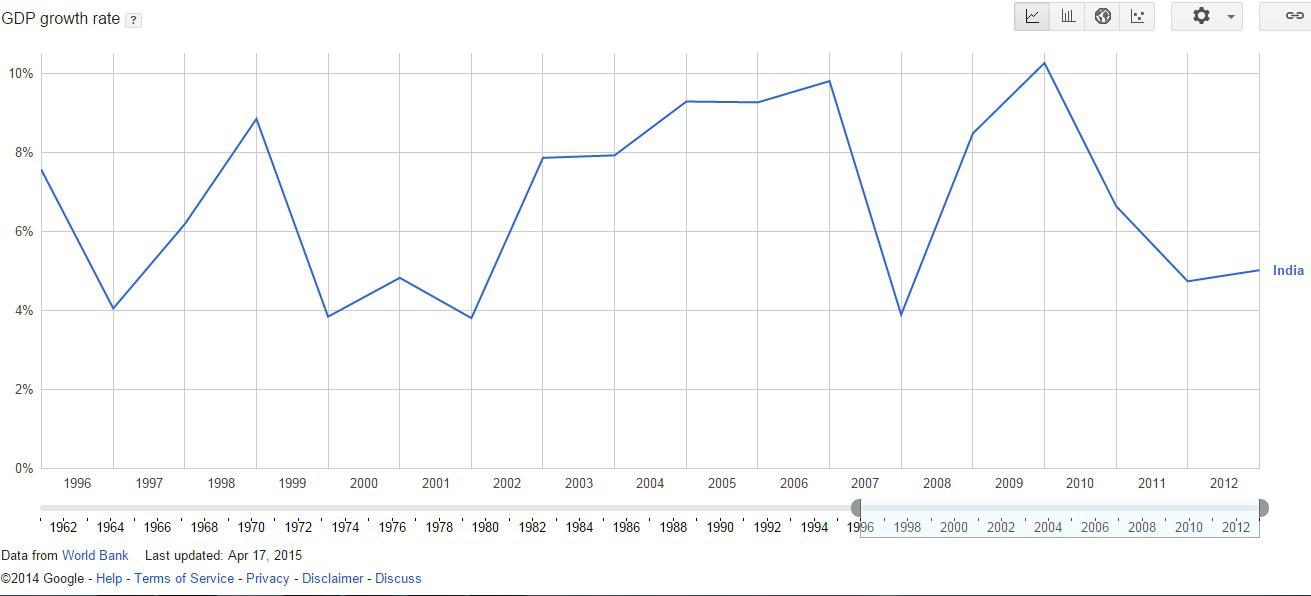
The IIP chart fits quite well with the India's GDP data over the same period.
(click to enlarge)
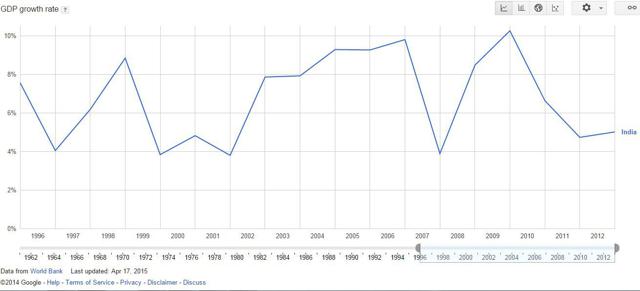
Source: World Development Indicators, World Bank; Google public data directory
True, there are masquerading voices within India with political inclinations who find nothing wrong in this overnight cure of the ailing economy. The same voices blamed the last government for the economic slowdown, which now becomes imaginary, as per the new methodology. The falling earnings (the last quarterly earnings of 101 companies, that declared results by 27th April or so, fell by 9.23%) and the continuous deterioration of balance sheets of companies, especially banks, convincingly debunk any such hypothesis. It also exposes the charade behind the new GDP numbers. Merely stating how the IIP numbers simply do not matter anymore in the methodology, directly or indirectly, may not be the whole truth. The deterioration of balance sheets is the root cause for the increasing NPAs in Indian banks, mostly state-owned ones, without any certainty as of now on whether or not NPAs have reached a saturation level. This is what RBI Governor Rajan said on NPAs on 17th April:
"The non-performing assets have been growing. I'm hopeful that we are near the peak or that we have even passed the peak, but we won't know until it is truly clear with the passage of time."
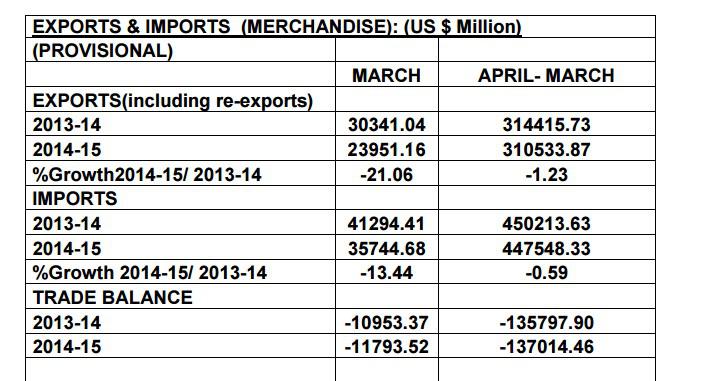
Similarly, a look at India's trade data shows a sharper slowdown (21%) in exports than in imports (13%) for the last reported month (March 2015). There is an overall decline in both for the year too. Exports in China, being an export-oriented economy unlike India's domestic consumption story, in March had dropped less compared to India's exports (14.6%); and in April, it further fell by 6.2%. Imports in China in March and April fell by 12.3% and 16.2%, respectively. In spite of China's economic slowdown, its exports for 2014 grew by 6.4%, and imports by 0.6%; whereas, revival of the Indian economy witnesses the opposite!
(click to enlarge)
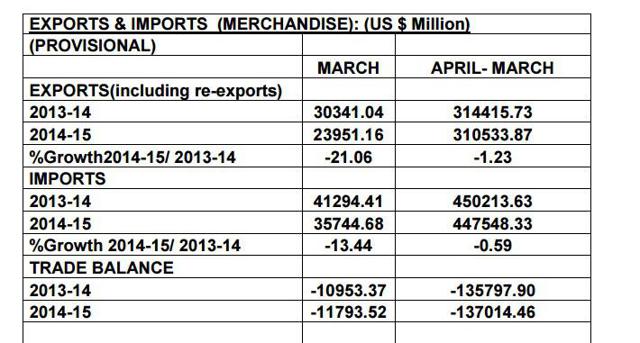
Source: Ministry of Commerce, Government of India
Some improvements can be seen, as the HSBC composite index for India, which maps both manufacturing and services, had a score of 52.5 (March 53, February 53.9), whereas for China it was 51.3.
It should be noted that much of India's economy still remains in the informal segment that was difficult to capture with accuracy three years ago, and it still remains mostly so.
Employment generation (in eight crucial sectors) was the lowest in three quarters in the last reported October-December quarter of 2014.
Finally, analyzing the mind of the Governor of the RBI, who needs to read most of the new GDP numbers chronologically. Here is what Dr. Raghuram Rajan said in February when the new GDP data was released:
"At this point, it is premature to take a strong view on the new GDP numbers… So, we find it hard to see the economy as rollicking in 2013-14."
One can also get a sense of what is going on in Rajan's mind when around the same time he says:
"Even if we stick to our growth projections of 5.5%, we are doing pretty well for this year."
By April, Rajan's struggle to read these new numbers worsened. Most importantly, the big danger, as Finalytics noted here is that the RBI might have to "shoot in the dark while recommending anything for monetary policy"henceforth when the Finance Minister is hopeful of double-digit growth soon, as the RBI needs to naturally examine possibilities of overheating of the economy.
Chief Economic Advisor Arvind Subramanian, an appointee of the current government, admitted that the new GDP growth figures had "puzzled" him. He suggested what Rajan explicitly did not: the new numbers may have been "'bumped up' and it was a mystery how to interpret them."
The concluding part of this series will review India's long-term bull market story when exchange rates get factored in. It proves to be a myth in comparison to the U.S. and China, since 1992 (Slide 10).
http://seekingalpha.com/article/3180526-myth-or-reality-scrutinizin...
-
-
India GDP growth is one-third statistical illusion
India’s GDP growth is now one-third a statistical mirage. Unless something has changed dramatically in recent years in how companies and consumers behave, the economy is more likely to be expanding at 5 percent, not the 7.5 percent claimed by the authorities.
The illusion comes from a recent supposed improvement in the way India calculates its Gross Domestic Product. In theory, Indian GDP is now closer to international standards. In practice it has become utterly unreliable. Depending on it could easily lead India’s monetary policy astray.
This week, investors dumped Indian assets after the Reserve Bank of India cut its benchmark interest rate by a quarter percentage point. Central bank governor Raghuram Rajan felt compelled to explain why he had reduced borrowing costs five days after the country’s statistics office claimed stellar expansion in GDP. But investors were upset that Rajan was not doing more to revive a slowing economy.
But just how sluggish is the economy really? Breakingviews tried to answer that question by looking at three indicators: corporate earnings, auto sales and imports of computer software. The logic is straightforward: retained earnings finance new investment projects; auto sales are a proxy for consumer demand; while software imports reflect productivity gains. Mixing the three in a simple index suggests that growth in the most recent quarter was closer to 5 percent.
Combining indicators of demand and supply will annoy the purists. However, the rough-and-ready gauge reliably predicted GDP growth in the coming quarter between 2005 and 2011.

Back then India’s methodology for adding up output was more robust. The new GDP data is another matter. Take the third quarter of 2013, when the country came perilously close to a currency crisis. The Breakingviews index shows GDP growth stalling. But according to the new official data, the economy grew at its fastest rate in nine quarters.
The faulty monitor continues to give misleading all-clear verdicts on the economy. It’s now more than a persistent irritant. There’s a serious risk that policymakers could underestimate the output shortfall, thereby aggravating the deficit. GDP is everywhere a statistical artifact; but in India, the illusion of growth is threatening to make the reality worse than it is already.
http://blogs.reuters.com/breakingviews/2015/06/05/india-gdp-growth-...

-
-
India registered 7% growth between April and June on Monday, making it one of the world’s fastest-growing economies, according t...
But other key indicators of economic vitality aren’t as positive.

- The Wall Street Journal made with Datawrapper
Vehicle sales last quarter didn’t show the kind of growth you would expect from an economy expanding at a rate of more than 7% per year. Car, truck and two-wheeler sales are good indicators of consumers, corporate and farmer sentiment respectively. Overall vehicles sales barely budged last quarter, rising just 1% to 4.89 million vehicles. Passenger vehicle sales were up 6.17%, commercial vehicle sales were up 3.55% and two-wheeler sales were up just 0.64%.
Indian officials had hoped for a pick-up in overseas demand for Indian-made products as Western economies gathered momentum. But the country’s exports have fallen for eight months in a row through July, underscoring continued stress in global economies.
In the year ended March 31, India’s exports totaled $310.5 billion, falling about 9% short of the $340 billion target. In the first four months of the current fiscal year things haven’t improved: goods exports have recorded a 15% decline–compared with the same period last year–to $89.83 billion. China’s move to devalue its currency has given its producers a competitive edge, damping export prospects of other economies, including India. In addition, the sharp drop in global crude oil prices, while good for India’s import bill, has come as a major downer for Indian petroleum product exports, which make up a big chunk of the South Asian economy’s total shipments.
The Indian currency hit a near two-year low against the dollar last week in the midst of the global selloff and was among the worst performing currencies in Asia. Fear among investors that the slowdown in China could cause a global slump was the main drag on the Indian currency. Analysts say the depreciation in the rupee is necessary to keep India’s exports competitive. They expect some more weakness later this year, depending on the U.S. Federal Reserve’s decision on lending rates. Foreign investors became big sellers in the Indian debt market in August, putting pressure on the rupee as they took dollars out of the local market.
The benchmark Sensex index was one of the top-performing indexes last year, but so far this year it has failed to shine. Since mid-2014, investors bought stocks on hopes that the economy would rise faster and boost profits. But that outcome has been elusive and analysts have started cutting their Sensex targets. Ambit Capital now sees the Sensex falling to 28,000 points, down from its earlier target of 32,000. If the Chinese devalue the yuan again, the Indian stock market could fall further.
Profits at big companies have barely budged since Prime Minister Narendra Modi came to power in India last year. The chart above shows the percentage growth of profits of companies in the benchmark Sensex index compared to a year earlier.
According to a Bank of America Merrill Lynch report, the profits of Sensex companies rose by only 1% during the April through June quarter, compared with 24% growth in the same period a year earlier.
Utilities and cement companies have dragged the average earnings growth as big private sector and government projects remained stuck waiting for government approvals. Metal and refining companies suffered due to the decline in oil and commodity prices.
http://blogs.wsj.com/indiarealtime/2015/09/01/5-indicators-that-con...


-
-
#India's GDP numbers are so dodgy that even the nation's central bank has doubts about them. #Modi #BJP http://qz.com/610767 via @qzindia
The skepticism arrived soon after India’s Central Statistical Office (CSO) put out revised GDP numbers last January.
India’s chief economic advisor, Arvind Subramanian, said he was puzzled and mystified by the revised estimates based on a new methodology, which instantly raised the country’s GDP growth from 4.7% to 6.9% for the 2013-14 fiscal year. Ruchir Sharma, head of emerging markets and global macro at Morgan Stanley Investment Management, called it a “bad joke.” And Raghuram Rajan, the governor of the Reserve Bank of India (RBI), said he didn’t want to talk about it until he understood the numbers better.
A whole year later, institutions like the RBI are so befuddled—and seemingly unconvinced—by India’s revised GDP numbers that they are looking at a range of other indicators to understand the true state of Asia’s third-largest economy.
“Like other economists, the RBI is now turning to hybrid models that mix elements of the old and new GDP methods to get a better feel for the underlying health of the economy,” Reuters reported on Feb. 5.
In particular, India’s central bank is tracking two-wheeler sales, car sales, rail freight, and consumer goods sales in rural areas “to get a better understanding of the ground realities,” an RBI official told Reuters. Quartz has emailed the RBI for comment, and will update if the bank replies.
The key contradiction is that even as prime minister Narendra Modi makes public declarations of India’s newfound status as the world’s fastest-growing major economy, key sectors such as manufacturing and agriculture are still stuck in a rut.
“The economy is recovering but it’s hard to be very definitive about the strength and breadth of the recovery for two reasons—economy is sending mixed signal and second there is some uncertainty how to interpret GDP data,” Subramanian explained late last year.
-
-
#India’s sharp growth picture gets fuzzy. #Indian GDP is rough estimate, not actual measurement http://on.wsj.com/1STK2Te via @WSJ #Modi #BJP
India’s economy expanded by 7.3% last year, outpacing every other major nation, including China, for the first time in nearly two decades.
But as with most developing countries, where official statistics can be dicey even when they aren’t showing world-beating growth, India’s economy defies easy measurement. Most enterprises are tiny and unregistered, and most workers are employed off the books. The government’s infrequent surveys represent only a best guess of the value being added in back-alley workshops, outdoor markets and other cash-based corners of the economy.
So even if India’s measurement of gross domestic product, a broad indicator of activity, isn’t thought to be politically manipulated like China’s, it should come with a warning label: Handle with care.
GDP in India, “much more than in other economies, is more an estimate than a measurement,” said Neelkanth Mishra, a Credit Suisse economist in Mumbai.
The fog surrounding India’s GDP places challenges before analysts and policy makers—and just plain baffles some of them. The country’s central bank, sensing an economy running at less-than-full blast despite strong headline growth, has cut its main interest rate five times since the start of 2015.
 ENLARGE
One reason for the data murkiness can be found on Lal Bazar Street, a busy thoroughfare of tea merchants, typists-for-hire and a sitar shop in the heart of Kolkata, the country’s onetime colonial capital.
AdvertisementWithin the dingy commercial buildings that line the roads in all directions are hundreds of addresses used to register shell companies, or ones used for tax-avoiding financial maneuvers and little else, tax authorities say.
Yet because these firms regularly file balance sheets to the government, they appear in a new official database of corporations—and get counted when statisticians tot up India Inc.’s contribution to national output.
India’s numbers have been under a microscope since it revised methods for estimating GDP last year, causing performance in earlier years to shoot up. Growth stayed brisk throughout 2015 even as exports, cargo traffic and other indicators disappointed.
A report from India’s Ministry of Finance said data-related uncertainty was causing economic signals to be “mixed, sometimes puzzling.”
The GDP revision included updates large and small. Based on an academic study of “dung evacuation rates,” goats and sheep were found to be contributing more to the economy, as producers of natural fertilizer, than previously thought. A much wider array of financial services is now being counted. But there are still areas where some observers, including the International Monetary Fund, see India’s data falling short.
To strip price changes out of a wide swath of GDP, for instance, India uses its wholesale price index—which, thanks to lower oil prices, has been decreasing for 17 straight months. But many businesses, particularly services like finance and information technology, haven’t benefited much: Retail prices are still climbing at around 5% a year overall. If India’s statisticians were factoring in more of these price rises, then their inflation-adjusted GDP figures would be lower.
In a March report on India, the IMF criticized the use of wholesale prices in GDP. In a written response to questions, the country’s Central Statistical Office acknowledged the issue, but said that until India updates its inflation measures, the wholesale price index “remains the best available alternative.”
“There’s no rhyme or reason why the service sector would be deflated by WPI,” said Kunal Kumar Kundu, Société Générale SA’s India economist. “It’s basically a data availability issue. That will always continue to be a challenge.”
Data availability is also a problem when it comes to small-time services like mom-and-pop stores, hairdressers and repair shops, which account for more than 5% of India’s GDP. The government comprehensively measures their activity only every few years, so sales-tax revenue is used to approximate growth in between—another practice the IMF criticized in its report. The statistics office said tax revenue is an accurate proxy.
India relies on another workaround to gauge corporations’ contribution to the economy. The new database includes hundreds of thousands of companies’ balance sheets. But because not all of them file on time each year, the statistics office has to extrapolate to produce an initial estimate of GDP.
This is where Kolkata’s shell entities may be entering the growth calculation. Income-tax authorities say they’ve logged 14,000 shell firms and counting in a new enforcement database.
T.C.A. Anant, India’s chief statistician, said shell companies are small by nature and unlikely to throw measurements off by much. “When you work with such large numbers, these things balance out.”
Whatever the data’s specific kinks, India’s GDP haze is sending some grasping for other tools.
Ambit Capital, a Mumbai-based brokerage, has created an index named after Li Keqiang,China’s premier, who once famously said his country’s GDP figures were “man-made.” Using vehicle sales, airport cargo, electricity demand and imports of machines and equipment, Ambit’s index indicates that momentum in India has been flagging since 2014.
Ila Patnaik, a former adviser in the finance ministry, said that in more than 20 years of studying India’s economy, the official GDP numbers have never appeared more out of step with other metrics.
“I don’t even know how to make sense of it,” she said. “Everything has gone out the window.”
-
-
Aakar Patel
@Aakar__Patel
chief economic advisors a thread
first one (2014-2018) concluded gdp growth was off by 2%. that meant that before pandemic, after slowing for 9 consecutive quarters (2 years and 3 months starting jan 2018) india gdp was growing at only 2%
govt shrugged
https://twitter.com/Aakar__Patel/status/1531851911854714880?s=20&am...
India's GDP growth overestimated by 2.5%, says former chief economic advisor
A new study by former chief economic advisor Arvind Subramaniam says the expansion was overestimated between 2011 and 2017
Rather than growing at about 7% a year in that period, growth was about 4.5%, according to the research paper
Read more at:
http://timesofindia.indiatimes.com/articleshow/69738363.cms?utm_sou...
----------------
Aakar Patel
@Aakar__Patel
his successor (2018-21) asked govt to release its own survey which showed indians were consuming less (incl on food) in 2018 than they were in 2012.
govt has not released survey
https://twitter.com/Aakar__Patel/status/1531852392399900672?s=20&am...
Economic adviser prod to release consumer expenditure survey report
After the demand was made by Subramanian, the government is at present considering its release
https://www.telegraphindia.com/india/economic-adviser-prod-to-relea...
A year after the NDA government withheld the release of a consumer expenditure survey for suspected discomfort over unfavourable findings, its chief economic adviser Krishnamurthy Subramanian has demanded its release, a minister has informed Parliament.
In response to a question in the Rajya Sabha by Congress members L. Hanumanthaiah and G.C. Chandrasekhar who wanted to know if the chief economic advisor had demanded to make the survey report public, minister of state for statistics and programme implementation Rao Inderjit Singh said in a written reply: “Yes Sir”.
The National Statistics Office (NSO) under the ministry of statistics and programme implementation had conducted an all-India survey on household consumer expenditure from the period July 2017 to June 2018. But the ministry decided not to release the report citing a higher divergence with the administrative data. According to a report in Business Standard, the survey found a fall in consumer spending for the first time in more than four decades.
After the demand was made by Subramanian, the government is at present considering to release the report.
“The ministry has followed a rigorous procedure for vetting of data and reports which are produced through surveys. The results of this survey were examined and it was observed that there was a significant variation in the levels in the consumption pattern as well as in the direction of the change while comparing with other administrative data sources. The matter is being looked into and finalisation of the results of the Consumer Expenditure Survey 2017-18 is under consideration,” the minister said.
Comment
Twitter Feed
Live Traffic Feed
Sponsored Links
South Asia Investor Review
Investor Information Blog
Haq's Musings
Riaz Haq's Current Affairs Blog
Please Bookmark This Page!
Blog Posts
Pakistani Student Enrollment in US Universities Hits All Time High
Pakistani student enrollment in America's institutions of higher learning rose 16% last year, outpacing the record 12% growth in the number of international students hosted by the country. This puts Pakistan among eight sources in the top 20 countries with the largest increases in US enrollment. India saw the biggest increase at 35%, followed by Ghana 32%, Bangladesh and…
ContinuePosted by Riaz Haq on April 1, 2024 at 5:00pm
Agriculture, Caste, Religion and Happiness in South Asia
Pakistan's agriculture sector GDP grew at a rate of 5.2% in the October-December 2023 quarter, according to the government figures. This is a rare bright spot in the overall national economy that showed just 1% growth during the quarter. Strong performance of the farm sector gives the much needed boost for about …
ContinuePosted by Riaz Haq on March 29, 2024 at 8:00pm
© 2024 Created by Riaz Haq.
Powered by
![]()
You need to be a member of PakAlumni Worldwide: The Global Social Network to add comments!
Join PakAlumni Worldwide: The Global Social Network